


In this section, we will see how to compute the slope of a curve. The slopes of curves tell an important story: they show the rate at which one variable changes with respect to another.
The slope of a curve equals the ratio of the change in the value of the variable on the vertical axis to the change in the value of the variable on the horizontal axis, measured between two points on the curve. You may have heard this called “the rise over the run.” In equation form, we can write the definition of the slope as
| Slope=vertical changehorizontal change |
Table 20.2 is the first equation in this text. Figure 20.5 provides a short review of working with equations. The material in this text relies much more heavily on graphs than on equations, but we will use equations from time to time. It is important that you understand how to use them.
Many equations in economics begin in the form of Table 20.2, with the statement that one thing (in this case the slope) equals another (the vertical change divided by the horizontal change). In this example, the equation is written in words. Sometimes we use symbols in place of words. The basic idea though, is always the same: the term represented on the left side of the equals sign equals the term on the right side. In Table 20.2 there are three variables: the slope, the vertical change, and the horizontal change. If we know the values of two of the three, we can compute the third. In the computation of slopes that follow, for example, we will use values for the two variables on the right side of the equation to compute the slope.
Figure 20.6 shows R1 and the computation of its slope between points B and D. Point B corresponds to 10 passengers on the bus; point D corresponds to 30. The change in the horizontal axis when we go from B to D thus equals 20 passengers. Point B corresponds to club revenues of $300; point D corresponds to club revenues of $500. The change in the vertical axis equals $200. The slope thus equals $200/20 passengers, or $10/passenger.
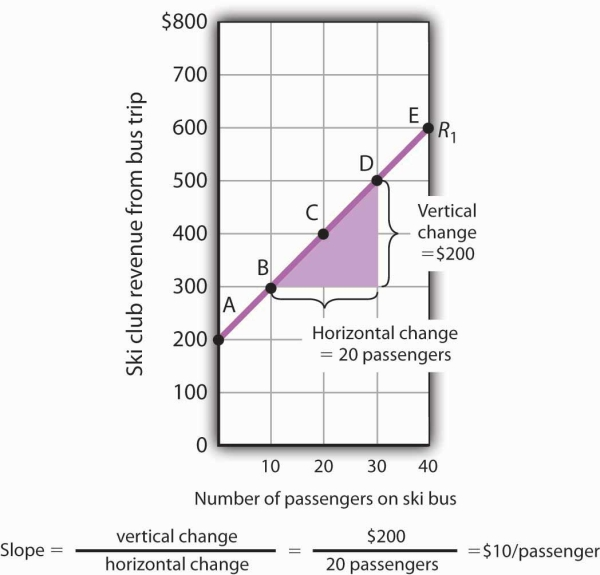
- Select two points; we have selected points B and D.
- The slope equals the vertical change divided by the horizontal change between the two points.
- Between points B and D, the slope equals $200/20 passengers = $10/passenger.
- The slope of this curve is the price per passenger. The fact that it is positive suggests a positive relationship between revenue per trip and the number of passengers riding the bus. Because the slope of this curve is $10/passenger between any two points on the curve, the relationship between club revenue per trip and the number of passengers is linear.
We have applied the definition of the slope of a curve to compute the slope of R1 between points B and D. That same definition is given in Table 20.2. Applying the equation, we have:
Slope=vertical changehorizontal change=$20020 passengers=$10/passenger
The slope of this curve tells us the amount by which revenues rise with an increase in the number of passengers. It should come as no surprise that this amount equals the price per passenger. Adding a passenger adds $10 to the club’s revenues.
Notice that we can compute the slope of R1 between any two points on the curve and get the same value; the slope is constant. Consider, for example, points A and E. The vertical change between these points is $400 (we go from revenues of $200 at A to revenues of $600 at E). The horizontal change is 40 passengers (from zero passengers at A to 40 at E). The slope between A and E thus equals$400/(40 passengers) = $10/passenger. We get the same slope regardless of which pair of points we pick on R1 to compute the slope. The slope of R1 can be considered a constant, which suggests that it is a straight line. When the curve showing the relationship between two variables has a constant slope, we say there is a linear relationship between the variables. A linear curve is a curve with constant slope.
The fact that the slope of our curve equals $10/passenger tells us something else about the curve—$10/passenger is a positive, not a negative, value. A curve whose slope is positive is upward sloping. As we travel up and to the right along R1, we travel in the direction of increasing values for both variables. A positive relationship between two variables is one in which both variables move in the same direction. Positive relationships are sometimes called direct relationships. There is a positive relationship between club revenues and passengers on the bus. We will look at a graph showing a negative relationship between two variables in the next section.
- 2839 reads
