


Available under Creative Commons-ShareAlike 4.0 International License.
A network of air monitoring stations has been established in Hong Kong (the stations are shown in Figure 1.3) and real-time air quality data taken from each monitoring station are transmitted via telephone lines to the air quality data processing centre in the EPD office for the calculation of API.
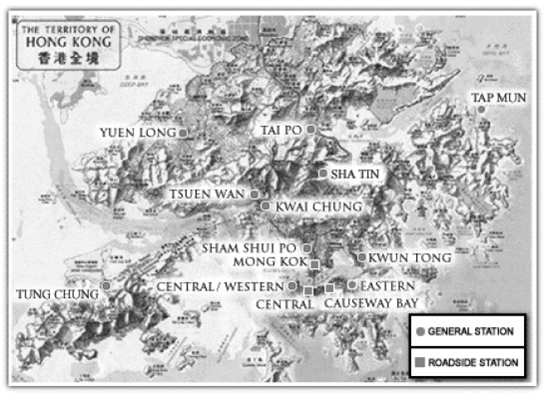
Figure 1.3 The Hong Kong air quality monitoring network
| API sub-index level | Relationship with HKAQO | Corresponding concentrations (µg/m3) | |||||||
|---|---|---|---|---|---|---|---|---|---|
| RSP 24-hr | SO2 24-hr | SO2 1-hr | NO2 24-hr | NO2 1-hr | CO 8-hr | CO 1-hr | O3 1-hr | ||
| 0 | - | 0 | 0 | 0 | 0 | 0 | 0 | 0 | 0 |
| 25 | 50% Annual HKAQO / 25% HKAQO | 28 | 40 | 200 | 40 | 75 | 2500 | 7500 | 60 |
| 50 | Annual HKAQO / 50% HKAQO | 55 | 80 | 400 | 80 | 150 | 5000 | 15000 | 120 |
| 100 | HKAQO | 180 | 350 | 800 | 150 | 300 | 10000 | 30000 | 240 |
| 200 | - | 350 | 800 | 1600 | 280 | 1130 | 17000 | 60000 | 400 |
| 300 | - | 420 | 1600 | 2400 | 565 | 2260 | 34000 | 90000 | 800 |
| 400 | - | 500 | 2100 | 3200 | 750 | 3000 | 46000 | 120000 | 1000 |
| 500 | - | 600 | 2620 | 4000 | 940 | 3750 | 57000 | 150000 | 1200 |
To view readings of the API for the last 24 hours, click here.
- 2133 reads
