


Example 4.3: Changing the Confidence Level
Suppose we change the original problem by using a 95% confidence level. Find a 95% confidence interval for the true (population) mean statistics exam score.
Solution
To find the confidence interval, you need the sample mean,  , and
the EBM.
, and
the EBM.

σ =3 ; n = 36 ; The confidence level is 95% (CL = 0.95)
CL = 0.95 so α = 1 − CL = 1 − 0.95 = 0.05


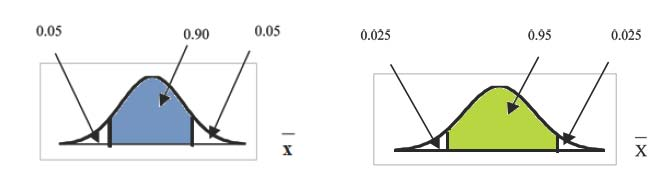
The area to the right of z.025 is 0.025 and the area to the left of z.025 is 1−0.025 = 0.975
using invnorm(.975,0,1) on the TI-83,83+,84+ calculators. (This can also be found using appropriate commands on other calculators, using a computer, or using a probability table for the
Standard Normal distribution.)


Interpretation
We estimate with 95% confidence that the true population mean for all statistics exam scores is between 67.02 and 68.98.
Explanation of 95% Confidence Level
95% of all confidence intervals constructed in this way contain the true value of the population mean statistics exam score.
Comparing the results
The 90% confidence interval is (67.18, 68.82). The 95% confidence interval is (67.02, 68.98). The 95% confidence interval is wider. If you look at the graphs, because the area 0.95 is larger than the area 0.90, it makes sense that the 95% confidence interval is wider.
Summary: Effect of Changing the Confidence Level
- Increasing the confidence level increases the error bound, making the confidence interval wider.
- Decreasing the confidence level decreases the error bound, making the confidence interval narrower.
Example 4.4: Changing the Sample Size:
Suppose we change the original problem to see what happens to the error bound if the sample size is changed.
See the following Problem.
Problem
Leave everything the same except the sample size. Use the original 90% confidence level. What happens to the error bound and the confidence interval if we increase the sample size and use n=100 instead of n=36? What happens if we decrease the sample size to n=25 instead of n=36?
-

-

- σ = 3 ; The confidence level is 90% (CL = 0.90) ;

Solution A
If we increase the sample size n to 100, we decrease the error bound.
When n = 100 : 
Solution B
If we decrease the sample size n to 25, we increase the error bound.
When n = 25 :
Summary: Effect of Changing the Sample Size
- Increasing the sample size causes the error bound to decrease, making the confidence interval narrower.
- Decreasing the sample size causes the error bound to increase, making the confidence interval wider.
- 83371 reads
