


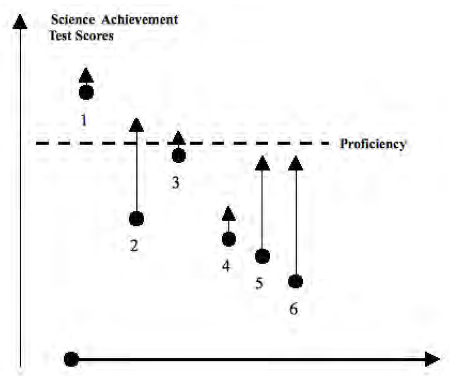
One concern with how AYP is calculated is that it is based on an absolute level of student performance at one point in time and does not measure how much students improve during each year. To illustrate this, the Figure 12.2 below shows six students whose science test scores improved from fourth to fifth grade. The circle represents a student's score in fourth grade and the tip of the arrow the test score in fifth grade. Note that students 1, 2, and 3 all reach the level of proficiency (the horizontal dotted line) but students 4, 5 and 6 do not. However, also notice that students 2, 5 and 6 improved much more than students 1, 3, and 4. The current system of AYP rewards students reaching the proficiency level rather than students' growth. This is a particular problem for low performing schools who may be doing an excellent job of improving achievement (students 5 and 6) but do not make the proficiency level. The US Department of Education in 2006 allowed some states to include growth measures into their calculations of AYP. While growth models traditionally tracked the progress of individual students, the term is sometimes used to refer to growth of classes or entire schools (Shaul, 2006).
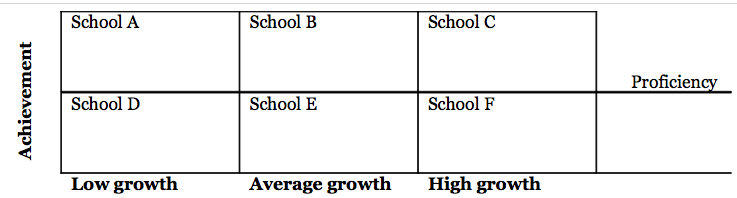
Some states include growth information on their report cards. For example, Tennessee (http://www.k-12.state.tn.us/rptcrd05/) provides details on which schools meet the AYP but also whether the students' scores on tests represent average growth, above average, or below average growth within the state. The Figure 12.3 below illustrates in a simple way the kind of information that is provided. Students in schools A, B, and C all reached proficiency and AYP but in Schools D, E, and F did not. However, students in schools A and D had low growth, in schools B and E average growth, in schools C and F high growth. Researchers have found that in some schools students have high levels of achievement but do not grow as much as expected (School A), and also that in some schools, the achievement test scores are not high but the students are growing or learning a lot (School F). These are called “school effects” and represent the effect of the school on the learning of the students.
- 瀏覽次數:1555
