


One of the most important implications of the concepts of comparative advantage and the production possibilities curve relates to international trade. We can think of different nations as being equivalent to Christie Ryder’s plants. Each will have a comparative advantage in certain activities, and efficient world production requires that each nation specialize in those activities in which it has a comparative advantage. A failure to allocate resources in this way means that world production falls inside the production possibilities curve; more of each good could be produced by relying on comparative advantage.
If nations specialize, then they must rely on each other. They will sell the goods in which they specialize and purchase other goods from other nations. Suppose, for example, that the world consists of two continents that can each produce two goods: South America and Europe can produce food and computers. Suppose they can produce the two goods according to the tables in Panels (a) and (b) of Figure 2.10. We have simplified this example by assuming that each continent has a linear production possibilities curve; the curves are plotted below the tables in Panels (a) and (b). Each continent has a separate production possibilities curve; the two have been combined to illustrate a world production possibilities curve in Panel (c) of the exhibit.
Suppose the world consists of two continents: South America and Europe. They can each produce two goods: food and computers. In this example, we assume that each continent has a linear production possibilities curve, as shown in Panels (a) and (b). South America has a comparative advantage in food production and Europe has a comparative advantage in computer production. With free trade, the world can operate on the bowed-out curve GHI, shown in Panel (c). If the continents refuse to trade, the world will operate inside its production possibilities curve. If, for example, each continent were to produce at the midpoint of its production possibilities curve, the world would produce 300 computers and 300 units of food per period at point Q. If each continent were to specialize in the good in which it has a comparative advantage, world production could move to a point such as H, with more of both goods produced.
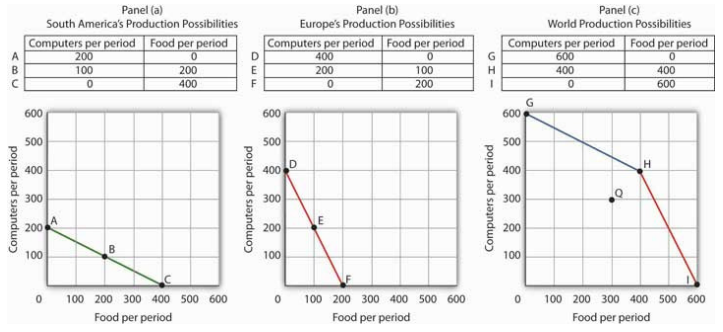
The world production possibilities curve assumes that resources are allocated between computer and food production based on comparative advantage. Notice that, even with only two economies and the assumption of linear production possibilities curves for each, the combined curve still has a bowed-out shape. At point H, for example, South America specializes in food, while Europe produces only computers. World production equals 400 units of each good. In this situation, we would expect South America to export food to Europe while Europe exports computers to South America.
But suppose the regions refuse to trade; each insists on producing its own food and computers. Suppose further that each chooses to produce at the midpoint of its own production possibilities curve. South America produces 100 units of computers and 200 units of food per period, while Europe produces 200 units of computers and 100 units of food per period. World production thus totals 300 units of each good per period; the world operates at point Q in Figure 2.10. If the two continents were willing to move from isolation to trade, the world could achieve an increase in the production of both goods. Producing at point H requires no more resources, no more effort than production at Q. It does, however, require that the world’s resources be allocated on the basis of comparative advantage.
The implications of our model for trade are powerful indeed. First, we see that trade allows the production of more of all goods and services. Restrictions on trade thus reduce production of goods and services. Second, we see a lesson often missed in discussions of trade: a nation’s trade policy has nothing to do with its level of employment of its factors of production. In our example, when South America and Europe do not engage in trade and produce at the midpoints of each of their respective production possibilities curves, they each have full employment. With trade, the two nations still operate on their respective production possibilities curves: they each have full employment. Trade certainly redistributes employment in the two continents. In South America, employment shifts from computer production to food production. In Europe, it shifts from food production to computer production. Once the shift is made, though, there is no effect on employment in either continent.
Of course, this idealized example would have all of South America’s computer experts becoming farmers while all of Europe’s farmers become computer geeks! That is a bit much to swallow, but it is merely the result of assuming linear production possibilities curves and complete specialization. In the real world, production possibilities curves are concave, and the reallocation of resources required by trade is not nearly as dramatic. Still, free trade can require shifts in resources from one activity to another. These shifts produce enormous benefits, but they do not come without costs.
Nearly all economists agree that largely unrestricted trade between countries is desirable; restrictions on trade generally force the world to operate inside its production possibilities curve. In some cases restrictions on trade could be desirable, but in the main, free trade promotes greater production of goods and services for the world’s people. The role of international trade is explored in greater detail in subsequent chapters of this book.
- 1526 reads
