


The market for crude oil took a radical turn in 1973. The price per barrel of crude oil quadrupled in 1973 and 1974. Price remained high until the early 1980s but then fell back drastically and remained low for about two decades. In 2004, the price of oil began to move upward and by 2008 had reached $147 per barrel.
What caused the dramatic increase in gasoline and oil prices in 2008? It appeared to be increasing worldwide demand outpacing producers’ ability—or willingness—to increase production much. This increase in demand is illustrated in Figure 4.2.
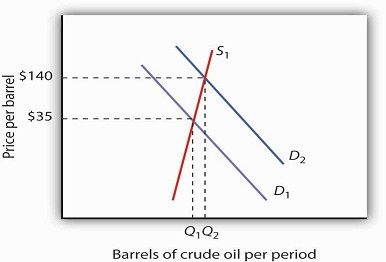
The price of oil was $35 per barrel at the beginning of 2004, as determined by the intersection of world demand, D1, and world supply, S1. Increasing world demand, prompted largely by increasing demand from China as well as from other countries, shifted world demand to D2, pushing the price as high as $140 per barrel by the middle of 2008.
Higher oil prices also increase the cost of producing virtually every good or service, as at a minimum, the production of most goods requires transportation. These costs inevitably translate into higher prices for nearly all goods and services. Supply curves of the goods and services thus affected shift to the left, putting downward pressure on output and upward pressure on prices.
Graphically, the impact of higher gasoline prices on businesses that use gasoline is illustrated in Figure 4.3. Because higher gasoline prices increase the cost of doing business, they shift the supply curves for nearly all businesses to the left, putting upward pressure on prices and downward pressure on output. In the case shown here, the supply curve in a typical industry shifts from S1 to S2. This increases the equilibrium price from P1 to P2 and reduces the equilibrium quantity from Q1 to Q2.
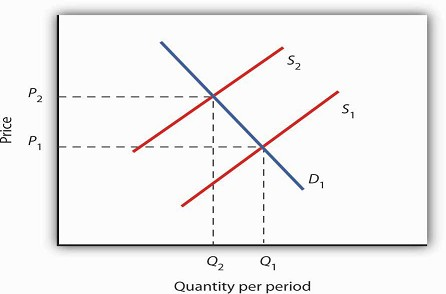
Higher gasoline prices increase the cost of producing virtually every good or service. In the case shown here, the supply curve in a typical industry shifts from S1 to S2. This increases the equilibrium price from P1 to P2 and reduces equilibrium quantity from Q1 to Q2.
Then, as the world economy slowed dramatically in the second half of 2008, the demand curve for oil shifted back to the left. By November 2008, the price per barrel had dropped back to below $60 per barrel. As gas prices also subsided, so did the threat of higher prices in other industries.
- 1613 reads
