


If we could measure utility, total utility would be the number of units of utility that a consumer gainsfrom consuming a given quantity of a good, service, or activity during a particular time period. The higher a consumer’s total utility, the greater that consumer’s level of satisfaction.
Panel (a) of Figure 7.1 shows the total utility Henry Higgins obtains from attending movies. In drawing his total utility curve, we are imagining that he can measure his total utility. The total utilitycurve shows that when Mr. Higgins attends no movies during a month, his total utility from attending movies is zero. As he increases the number of movies he sees, his total utility rises. When he consumes1 movie, he obtains 36 units of utility. When he consumes 4 movies, his total utility is 101. He achieves the maximum level of utility possible, 115, by seeing 6 movies per month. Seeing a seventh movie adds nothing to his total utility.
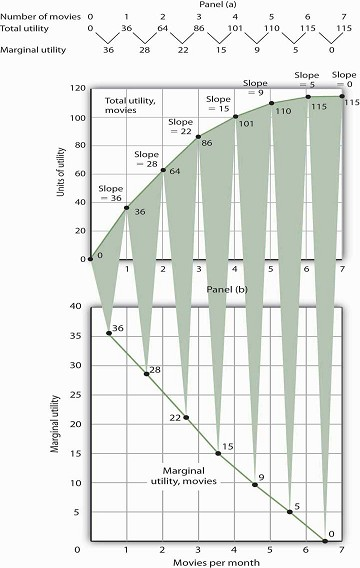
Panel (a) shows Henry Higgins’s total utility curve for attending movies. It rises as the number of movies increases,reaching a maximum of 115 units of utility at 6 movies per month. Marginal utility is shown in Panel (b); it is the slope of the total utility curve. Because the slope of the total utility curve declines as the number of movies increases, the marginal utility curve is downward sloping.
Mr. Higgins’s total utility rises at a decreasing rate. The rate of increase is given by the slope of the totalutility curve, which is reported in Panel (a) of Figure 7.1 as well. The slope of the curve between 0 movies and 1 movie is 36 because utility rises by this amount when Mr. Higgins sees his first movie inthe month. It is 28 between 1 and 2 movies, 22 between 2 and 3, and so on. The slope between 6 and 7 movies is zero; the total utility curve between these two quantities is horizontal.
- 1802 reads
