


Suppose you were asked to determine whether a particular family was poor or not poor. How would you do it?
You might begin by listing the goods and services that would be needed to provide a minimum standard of living and then finding out if the family’s income was enough to purchase those items. If itwere not, you might conclude that the family was poor. Alternatively, you might examine the family’s income relative to the incomes of other families in the community or in the nation. If the family was on the low end of the income scale, you might classify it as poor.
These two approaches represent two bases on which poverty is defined. The first is an absolute income test, which sets a specific income level and defines a person as poor if his or her income falls below that level. The second is a relative income test, in which people whose incomes fall at the bottom of the income distribution are considered poor. For example, we could rank households according to income as we did in the previous section on income inequality and define the lowest one-fifth of households as poor. In 2006, any U.S. household with an annual income below $20,035 fell in this category.
In contrast, to determine who is poor according to the absolute income test, we define a specific level of income, independent of how many households fall above or below it. The federal government defines a household as poor if the household’s annual income falls below a dollar figure called the poverty line. In 2006 the poverty line for a family of four was an income of $20,614. Figure Figure 19.2 shows the poverty line for various family sizes.
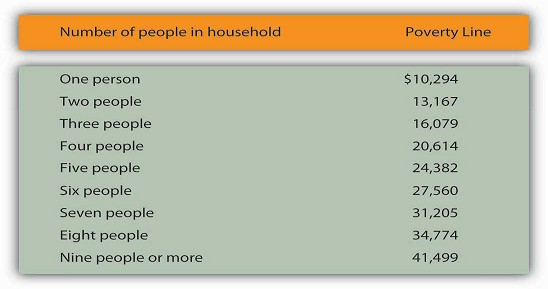
The Census Bureau uses a set of 48 money income thresholds that vary by family size and composition to determine who is in poverty. The “Weighted Average Poverty Thresholds” in the accompanying table is a summary of the 48 thresholds used by the census bureau. It provides a general sense of the “poverty line” based on the relative number of families by size and composition.
Source: DeNavas-Walt, Carmen, Bernadette D. Proctor, and Jessica Smith, U.S. Census Bureau, Current Population Reports, P60-233, Income, Poverty, and Health Insurance Coverage in the United States: 2006, U.S. Government Printing Office, Washington, D.C., 2007; p. 45.
The concept of a poverty line grew out of a Department of Agriculture study in 1955 that found families spending one-third of their incomes on food. With the one-third figure as a guide, the Department then selected four food plans that met the minimum daily nutritional requirements established by the federal government. The cost of the least expensive plan for each household size was multiplied by three to determine the income below which a household would be considered poor. The government used this method to count the number of poor people from 1959 to 1969. The poverty line was adjusted each year as food prices changed. Beginning in 1969, the poverty line was adjusted annually by the average percentage price change for all consumer goods, not just changes in the price of food.
There is little to be said for this methodology for defining poverty. No attempt is made to establish an income at which a household could purchase basic necessities. Indeed, no attempt is made in the definition to establish what such necessities might be. The day has long passed when the average household devoted one-third of its income to food purchases; today such purchases account for less than one-fifth of household income. Still, it is useful to have some threshold that is consistent from one year to the next so that progress—or the lack thereof—in the fight against poverty can be assessed.
The percentage of the population that falls below the poverty line is called the poverty rate. Figure Figure 19.3 shows both the number of people and the percentage of the population that fell below the poverty line each year since 1959.
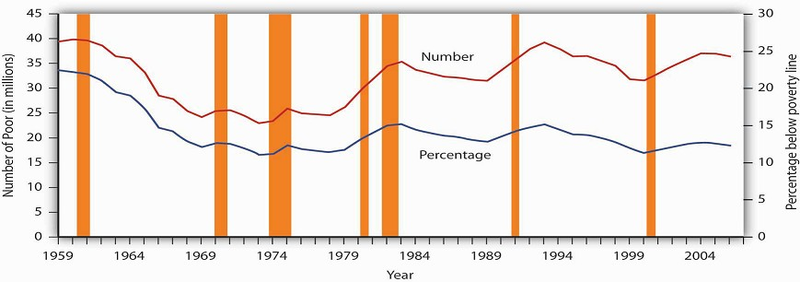
The curve shows the percentage of people who lived in households that fell below the poverty line in each year from 1959 to 2006. The poverty rate has generally fallen since 1959. Still, the poverty rate in the United States is greater than that of any other industrialized nation.
Source: DeNavas-Walt, Carmen, Bernadette D. Proctor, and Jessica Smith, U.S. Census Bureau, Current Population Reports P60-233, Income, Poverty, and Health Insurance Coverage in the United States: 2006, U.S. Government Printing Office, Washington DC, 2007; Table B-1, p. 44.
Despite its shortcomings, measuring poverty using an absolute measure allows for the possibility of progress in reducing it; using a relative measure of poverty does not, since there will always be a lowest 1/5, or 1/10 of the population. But relative measures do make an important point: Poverty is in large measure a relative concept. In the United States, poor people have much higher incomes than most of the world’s people or even than average Americans did as recently as the early 1970s. By international and historical standards, the average poor person in the United States is rich! The material possessions of America’s poor would be considered lavish in another time and in another place. For example, in 2005, 43% of poor households in the United States owned their own homes, nearly 75% owned a car, and 78% owned a VCR. About 80% of poor households had air conditioning. Forty years ago, only 36%
of the entire population in the United States had air conditioning. The average poor person in the United States has more living space than the average person in London, Paris, Vienna, or Athens.[6]
We often think of poverty as meaning that poor people are unable to purchase adequate food. Yet, according to Department of Agriculture surveys, 89% of poor people report that they have adequate food. Only 2% reported that they are hungry most of the time. In short, poor people in the United States enjoy a standard of living that would be considered quite comfortable in many parts of the developed world—and lavish in the less developed world.
But people judge their incomes relative to incomes of people around them, not relative to people everywhere on the planet or to people in years past. You may feel poor when you compare yourself to some of your classmates who may have fancier cars or better clothes. And a family of four in a Los Angeles slum with an annual income of $13,000 surely does not feel rich because its income is many times higher than the average family income in Ethiopia or of Americans of several decades ago. While the material possessions of poor Americans are vast by Ethiopian standards, they are low in comparison to how the average American lives. What we think of as poverty clearly depends more on what people around us are earning than on some absolute measure of income.
Both the absolute and relative income approaches are used in discussions of the poverty problem. When we speak of the number of poor people, we are typically using an absolute income test of poverty. When we speak of the problems of those at the bottom of the income distribution, we are speaking in terms of a relative income test. In the European Union, for example, the poverty line is set at 60% of the median income of each member nation in a particular year. That is an example of a relative measure of poverty. In the rest of this section, we focus on the absolute income test of poverty used in the United States.
- 1286 reads
