


A change in any component of aggregate demand shifts the aggregate demand curve. Generally, the aggregate demand curve shifts by more than the amount by which the component initially causing it to shift changes.
Suppose that net exports increase due to an increase in foreign incomes. As foreign demand for domestically made products rises, a country’s firms will hire additional workers or perhaps increase the average number of hours that their employees work. In either case, incomes will rise, and higher incomes will lead to an increase in consumption. Taking into account these other increases in the components of aggregate demand, the aggregate demand curve will shift by more than the initial shift caused by the initial increase in net exports.
The multiplier is the ratio of the change in the quantity of real GDP demanded at each price level to the initial change in one or more components of aggregate demand that produced it:
EQUATION 22.1
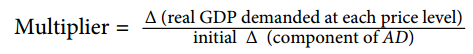
We use the capital Greek letter delta (Δ) to mean “change in.” In the aggregate demand–aggregate supply model presented in this chapter, it is the number by which we multiply an initial change in aggregate demand to obtain the amount by which the aggregate demand curve shifts as a result of the initial change. In other words, we can use Equation 22.1 to solve for the change in real GDP demanded at each price level:
EQUATION 22.2
Δ (real GDP demanded at each price level) = multiplier × initial Δ (component of AD)
Suppose that the initial increase in net exports is $100 billion and that the initial $100-billion increase generates additional consumption of $100 billion at each price level. In Panel (a) of Figure 22.3, the aggregate demand curve shifts to the right by $200 billion—the amount of the initial increase in net exports times the multiplier of 2. We obtained the value for the multiplier in this example by plugging $200 billion (the initial $100-billion increase in net exports plus the $100-billion increase that it generated in consumption) into the numerator of Equation 22.1 and $100 billion into the denominator. Similarly, a decrease in net exports of $100 billion leads to a decrease in aggregate demand of $200 billion at each price level, as shown in Panel (b).
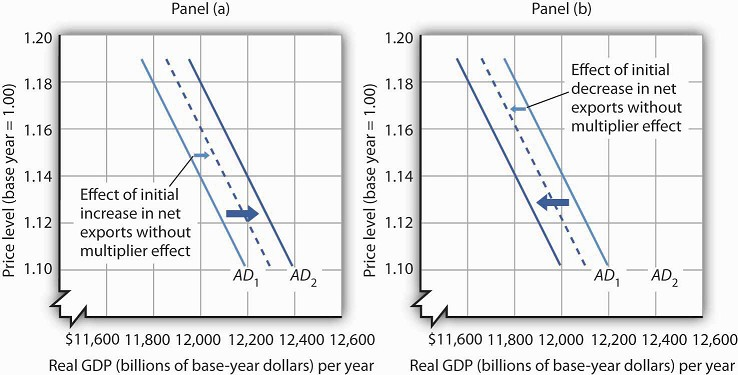
A change in one component of aggregate demand shifts the aggregate demand curve by more than the initial change. In Panel (a), an initial increase of $100 billion of net exports shifts the aggregate demand curve to the right by $200 billion at each price level. In Panel (b), a decrease of net exports of $100 billion shifts the aggregate demand curve to the left by $200 billion. In this example, the multiplier is 2.
KEY TAKEAWAYS
- Potential output is the level of output an economy can achieve when labor is employed at its natural level. When an economy fails to produce at its potential, the government or the central bank may try to push the economy toward its potential.
- The aggregate demand curve represents the total of consumption, investment, government purchases, and net exports at each price level in any period. It slopes downward because of the wealth effect on consumption, the interest rate effect on investment, and the international trade effect on net exports.
- The aggregate demand curve shifts when the quantity of real GDP demanded at each price level changes. The multiplier is the number by which we multiply an initial change in aggregate demand to obtain the amount by which the aggregate demand curve shifts at each price level as a result of the initial change.
TRY IT!
Explain the effect of each of the following on the aggregate demand curve for the United States:
- A decrease in consumer optimism
- An increase in real GDP in the countries that buy U.S. exports
- An increase in the price level
- An increase in government spending on highways
Case in Point: The Multiplied Economic Impact of SARS on China’s Economy
Severe Acute Respiratory Syndrome (SARS), an atypical pneumonia-like disease, broke onto the world scene in late 2002. In March 2003, the World Health Organization (WHO) issued its first
worldwide alert and a month later its first travel advisory, which recommended that travelers avoid Hong Kong and the southern province of China, Guangdong. Over the next few months,
additional travel advisories were issued for other parts of China, Taiwan, and briefly for Toronto, Canada. By the end of June, all WHO travel advisories had been removed.
To estimate the overall impact of SARS on the Chinese economy in 2003, economists Wen Hai, Zhong Zhao,and Jian Want of Peking University’s China Center for Economic Research conducted a
survey of Beijing’s tourism industry in April 2003. Based on findings from the Beijing area, they projected the tourism sector of China as a whole would lose $16.8 billion—of which $10.8
billion came from an approximate 50% reduction in foreign tourist revenue and $6 billion from curtailed domestic tourism, as holiday celebrations were cancelled and domestic travel
restrictions imposed.
To figure out the total impact of SARS on China’s economy, they argued that the multiplier for tourism revenue in China is between 2 and 3. Since the SARS outbreak only began to have a major
economic impact after March, they assumed a smaller multiplier of 1.5 for all of 2003. They thus predicted that the Chinese economy would be $25.3 billion smaller in 2003 as a result of
SARS:
Source: Wen Hai, Zhong Zhao, and Jian Wan, “The Short-Term Impact of SARS on the Chinese Economy,” Asian Economic Papers 3, no. 1 (Winter 2004): 57–61.
ANSWER TO TRY IT! PROBLEM
- A decline in consumer optimism would cause the aggregate demand curve to shift to the left. If consumers are more pessimistic about the future, they are likely to cut purchases especially of major items.
- An increase in the real GDP of other countries would increase the demand for U.S. exports and cause the aggregate demand curve to shift to the right. Higher incomes in other countries will make consumers in those countries more willing and able to buy U.S. goods.
- An increase in the price level corresponds to a movement up along the unchanged aggregate demand curve. At the higher price level, the consumption, investment, and net export components of aggregate demand will all fall; that is, there will be a reduction in the total quantity of goods and services demanded, but not a shift of the aggregate demand curve itself.
- An increase in government spending on highways means an increase in government purchases. The aggregate demand curve would shift to the right.
- 2643 reads
