


Now suppose the market for money is in equilibrium and the Fed changes the money supply. All other things unchanged, how will this change in the money supply affect the equilibrium interest rate and aggregate demand, real GDP, and the price level?
Suppose the Fed conducts open-market operations in which it buys bonds. This is an example of expansionary monetary policy. The impact of Fed bond purchases is illustrated in Panel (a) of Figure 25.10. The Fed’s purchase of bonds shifts the demand curve for bonds to the right, raising bond prices to Pb2. As we learned, when the Fed buys bonds, the supply of money increases. Panel (b) of Figure 25.10 shows an economy with a money supply of M, which is in equilibrium at an interest rate of r1. Now suppose the bond purchases by the Fed as shown in Panel (a) result in an increase in the money supply to M′; that policy change shifts the supply curve for money to the right to S2. At the original interest rate r1, people do not wish to hold the newly supplied money; they would prefer to hold nonmoney assets. To reestablish equilibrium in the money market, the interest rate must fall to increase the quantity of money demanded. In the economy shown, the interest rate must fall to r2 to increase the quantity of money demanded to M′.
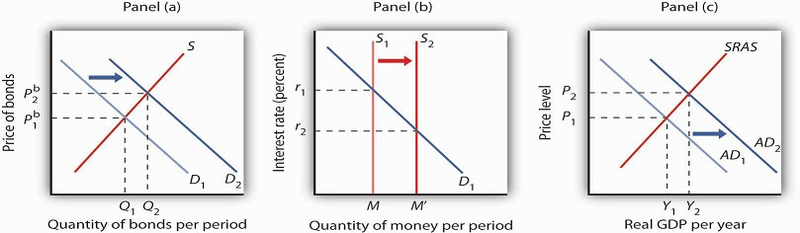
The Fed increases the money supply by buying bonds, increasing the demand for bonds in Panel (a) from D1 to D2 and the price of bonds to Pb 2. This corresponds to an increase in the money supply to M′ in Panel (b). The interest rate must fall to r2 to achieve equilibrium. The lower interest rate leads to an increase in investment and net exports, which shifts the aggregate demand curve from AD1 to AD2 in Panel (c). Real GDP and the price level rise.
The reduction in interest rates required to restore equilibrium to the market for money after an increase in the money supply is achieved in the bond market. The increase in bond prices lowers interest rates, which will increase the quantity of money people demand. Lower interest rates will stimulate investment and net exports, via changes in the foreign exchange market, and cause the aggregate demand curve to shift to the right, as shown in Panel (c), from AD1 to AD2. Given the short-run aggregate supply curve SRAS, the economy moves to a higher real GDP and a higher price level.
Open-market operations in which the Fed sells bonds—that is, a contractionary monetary policy— will have the opposite effect. When the Fed sells bonds, the supply curve of bonds shifts to the right and the price of bonds falls. The bond sales lead to a reduction in the money supply, causing the money supply curve to shift to the left and raising the equilibrium interest rate. Higher interest rates lead to a shift in the aggregate demand curve to the left.
As we have seen in looking at both changes in demand for and in supply of money, the process of achieving equilibrium in the money market works in tandem with the achievement of equilibrium in the bond market. The interest rate determined by money market equilibrium is consistent with the interest rate achieved in the bond market.
KEY TAKEAWAYS
- People hold money in order to buy goods and services (transactions demand), to have it abailable for ontingences (precautionary demand), and in order to avoid possible drops in the value of other assets such as bonds (speculative demand).
- The higher the interest rate, the lower the quantities of money demanded for transactions, for precautionary, and for speculative purposes. The lower the interest rate, the higher the quantities of money demanded for these purposes.
- The demand for money will change as a result of a change in real GDP, the price level, transfer costs, expectations, or preferences.
- We assume that the supply of money is determined by the Fed. The supply curve for money is thus a vertical line. Money market equilibrium occurs at the interest rate at which the quantity of money demanded equals the quantity of money supplied.
- All other things unchanged, a shift in money demand or supply will lead to a change in the equilibrium interest rate and therefore to changes in the level of real GDP and the price level.
TRY IT!
In 2005 the Fed was concerned about the possibility that the United States was moving into an inflationary gap, and it adopted a contractionary monetary policy as a result. Draw a four-panel graph showing this policy and its expected results. In Panel (a), use the model of aggregate demand and aggregate supply to illustrate an economy with an inflationary gap. In Panel (b), show how the Fed’s policy will affect the market for bonds. In Panel (c), show how it will affect the demand for and supply of money. In Panel (d), show how it will affect the exchange rate. Finally, return to Panel (a) and incorporate these developments into your analysis of aggregate demand and aggregate supply, and show how the Fed’s policy will affect real GDP and the price level in the short run.
Case in Point: Money in Today’s World
The models of the money and bond markets presented in this chapter suggest that the Fed can control the interest rate by deciding on a money supply that would lead to the desired equilibrium
interest rate in the money market. Yet, Fed policy announcements typically focus on what it wants the federal funds rate to be with scant attention to the money supply. Whereas throughout the
1990s, the Fed would announce a target federal funds rate and also indicate an expected change in the money supply, in 2000, when legislation requiring it to do so expired, it abandoned the
practice of setting money supply targets. Why the shift? The factors that have made focusing on the money supply as a policy target difficult for the past 25 years are first banking
deregulation in the 1980s followed by financial innovations associated with technological changes—in particular the maturation of electronic payment and transfer mechanisms —thereafter.
Before the 1980s, M1 was a fairly reliable measure of the money people held, primarily for transactions. To buy things, one used cash, checks written on demand deposits, or traveler’s checks.
The Fed could thus use reliable estimates of the money demand curve to predict what the money supply would need to be in order to bring about a certain interest rate in the money
market.
Legislation in the early 1980s allowed for money market deposit accounts (MMDAs), which are essentially interest-bearing savings accounts on which checks can be written. MMDAs are part of M2.
Shortly after, other forms of payments for transactions developed or became more common. For example, credit and debit card use has mushroomed (from $10.8 billion in 1990 to $30 billion in
2000), and people can pay their credit card bills, electronically or with paper checks, from accounts that are part of either M1 or M2. Another innovation of the last 20 years is the
automatic transfer service (ATS) that allows consumers to move money between checking and savings accounts at an ATM machine, or online, or through prearranged agreements with their financial
institutions. While we take these methods of payment for granted today, they did not exist before 1980 because of restrictive banking legislation and the lack of technological know-how.
Indeed, before 1980, being able to pay bills from accounts that earned interest was unheard of.
Further blurring the lines between M1 and M2 has been the development and growing popularity of what are called retail sweep programs. Since 1994, banks have been using retail-sweeping
software to dynamically reclassify balances as either checking account balances (part of M1) or MMDAs (part of M2). They do this to avoid reserve requirements on checking accounts. The
software not only moves the funds but also ensures that the bank does not exceed the legal limit of six reclassifications in any month. In the last 10 years these retail sweeps rose from zero
to nearly the size of M1 itself!
Such changes in the ways people pay for transactions and banks do their business have led economists to think about new definitions of money that would better track what is actually used for
the purposes behind the money demand curve. One notion is called MZM, which stands for “money zero maturity.” The idea behind MZM is that people can easily use any deposits that do not have
specified maturity terms to pay for transactions, as these accounts are quite liquid, regardless of what classification of money they fall into. Some research shows that using MZM allows for
a stable picture of the money market. Until more agreement has been reached, though, we should expect the Fed to continue to downplay the role of the money supply in its policy deliberations
and to continue to announce its intentions in terms of the federal funds rate.
Source: Pedre Teles and Ruilin Zhou, “A Stable Money Demand: Looking for the Right Monetary Aggregate,” Federal Reserve Bank of Chicago Economic Perspectives 29
(First Quarter, 2005): 50–59.
ANSWER TO TRY IT! PROBLEM
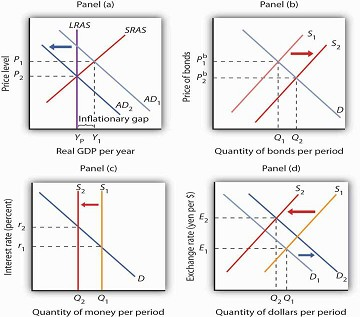
In Panel (a), with the aggregate demand curve AD1, short-run aggregate supply curve SRAS, and long-run aggregate supply curve LRAS, the economy has an inflationary gap of Y1 − YP. The
contractionary monetary policy means that the Fed sells bonds—a rightward shift of the bond supply curve in Panel (b), which decreases the money supply—as shown by a leftward shift in the
money supply curve in Panel (c). In Panel (b), we see that the price of bonds falls, and in Panel (c) that the interest rate rises. A higher interest rate will reduce the quantity of
investment demanded. The higher interest rate also leads to a higher exchange rate, as shown in Panel (d), as the demand for dollars increases and the supply decreases. The higher exchange
rate will lead to a decrease in net exports. As a result of these changes in financial markets, the aggregate demand curve shifts to the left to AD2 in Panel (a). If all goes according to
plan (and we will learn in the next chapter that it may not!), the new aggregate demand curve will intersect SRAS and LRAS at YP.
- 4419 reads
