


A transfer payment is the provision of aid or money to an individual who is not required to provide anything in exchange. Social Security and welfare benefits are examples of transfer payments. Transfer payments have become much more important in the past few decades.
A number of changes have influenced transfer payments over the past several decades. First, they increased rapidly during the late 1960s and early 1970s. This was the period in which federal programs such as Medicare (health insurance for the elderly) and Medicaid (health insurance for the poor) were created and other programs were expanded.
Figure 27.2 shows that transfer payment spending by the federal government and by state and local governments has risen as a percentage of GDP. In 1960, such spending totaled about 6% of GDP; by 2007, it had risen to about 15%. The federal government accounts for the bulk of transfer payment spending in the United States.
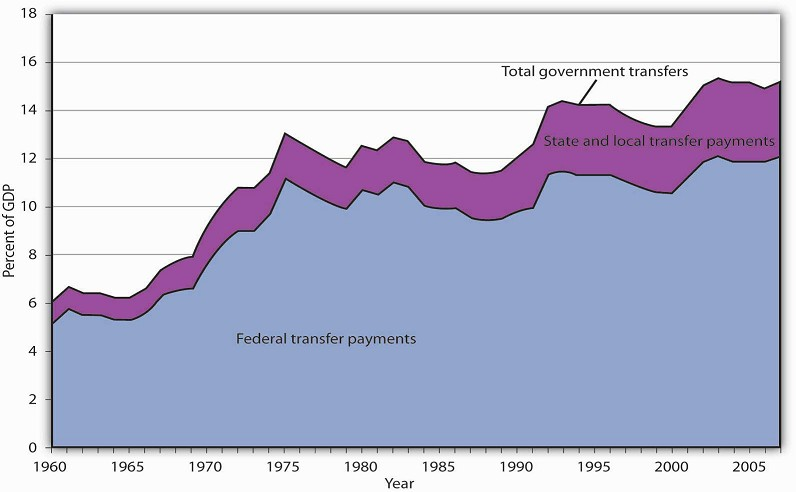
The chart shows transfer payment spending as a percentage of GDP from 1960 through 2007. This spending rose dramatically relative to GDP during the late 1960s and the 1970s as federal programs expanded. More recently, sharp increases in health-care costs have driven upward the spending for transfer payment programs such as Medicare and Medicaid. Transfer payments fluctuate with the business cycle, rising in times of recession and falling during times of expansion.
Source: Bureau of Economic Analysis, NIPA Table 1.1, 3.2, and 3.3 (December 23, 2008 revision).
Transfer payment spending relative to GDP tends to fluctuate with the business cycle. Transfer payments fell during the late 1970s, a period of expansion, then rose as the economy slipped into a recessionary gap during the 1979–1982 period. Transfer payments fell during the expansion that began late in 1982, then began rising in 1989 as the expansion began to slow. Transfer payments continued to rise relative to GDP during the recessions of 1990–1991 and 2001–2002 and then fell as the economy entered expansionary phases after each of those recessions. With the current recession, transfers are rising again.
When economic activity falls, incomes fall, people lose jobs, and more people qualify for aid. People qualify to receive welfare benefits, such as cash, food stamps, or Medicaid, only if their income falls below a certain level. They qualify for unemployment compensation by losing their jobs. More people qualify for transfer payments during recessions. When the economy expands, incomes and employment rise, and fewer people qualify for welfare or unemployment benefits. Spending for those programs therefore tends to fall during an expansion.
Figure 27.3 summarizes trends in government spending since 1960. It shows three categories of government spending relative to GDP: government purchases, transfer payments, and net interest. Net interest includes payments of interest by governments at all levels on money borrowed, less interest earned on saving.
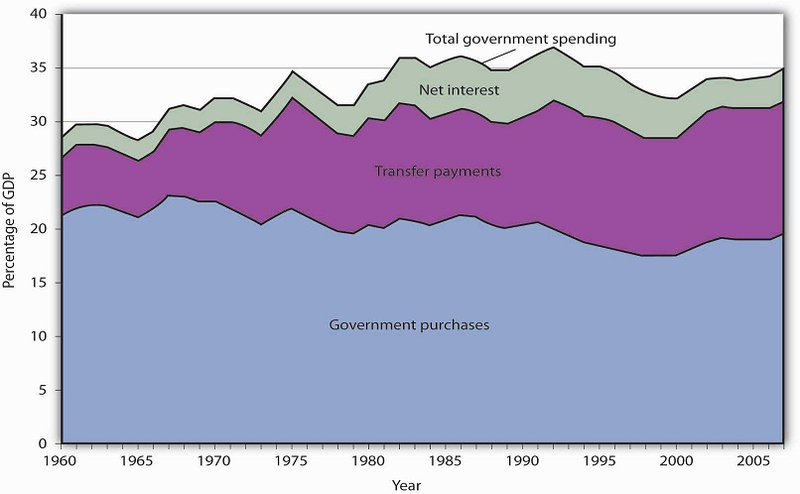
Source: Bureau of Economic Analysis, NIPA Table 1.1 and 3.1 (December 23, 2008 revision).
- 1455 reads
