


The consumption function graphed in Figure 28.2 and Figure 28.3 relates consumption spending to the level of disposable personal income. Changes in disposable personal income cause movements along this curve; they do not shift the curve. The curve shifts when other determinants of consumption change. Examples of changes that could shift the consumption function are changes in real wealth and changes in expectations. Figure 28.4 illustrates how these changes can cause shifts in the curve.
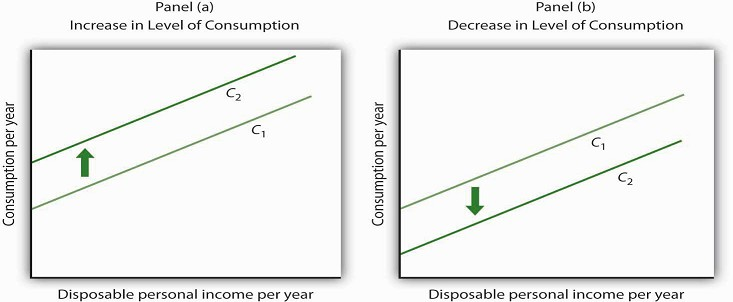
An increase in the level of consumption at each level of disposable personal income shifts the consumption function upward in Panel (a). Among the events that would shift the curve upward are an increase in real wealth and an increase in consumer confidence. A reduction in the level of consumption at each level of disposable personal income shifts the curve downward in Panel (b). The events that could shift the curve downward include a reduction in real wealth and a decline in consumer confidence.
- 1894 reads
