


The effort to nudge the economy back down the Phillips curve to an unemployment rate closer to the natural level and a lower rate of inflation met with an unhappy surprise in 1970. Unemployment increased as expected. But inflation rose! The inflation rate rose to 5.3% from its 1969 rate of 4.8%.
The tidy relationship between inflation and unemployment that had been suggested by the experience of the 1960s fell apart in the 1970s. Unemployment rose substantially, but inflation remained the same in 1971. In 1972, both rates fell. The economy seemed to fall back into the pattern described by the Phillips curve in 1973, as inflation rose while unemployment fell. But the next two years saw increases in both rates. The Phillips curve relationship between inflation and unemployment that had seemed to hold true in the 1960s no longer prevailed.
Indeed, a look at annual rates of inflation and unemployment since 1961 suggests that the 1960s were quite atypical. Figure 31.3 shows the two variables over the period from 1961 through 2008. It is hard to see a Phillips curve lurking within that seemingly random scatter of points.
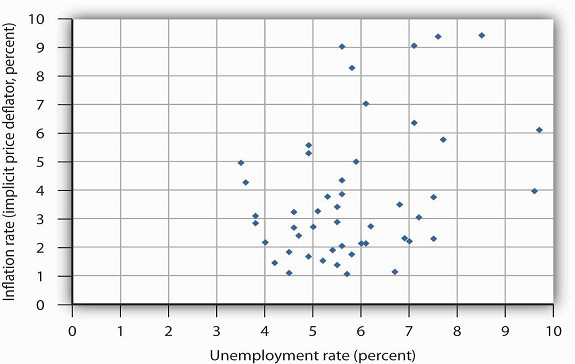
Sources: Economic Report of the President, 2009, Tables B-3 and B-42; data for 2008 are from the Bureau of Economic Analysis, Table 1.14 (revised March 26, 2009) and the Bureau of Labor Statistics (extracted April 14, 2009).
- 1635 reads
