


Available under Creative Commons-NonCommercial-ShareAlike 4.0 International License.
Demand can be derived from the indifference curves by lowering (increasing) the price of one good and observing that the budget line will shift as a result, causing the point of tangency to reflect a larger (smaller) quantity purchased of that good.
Review Quiz
- The supply of goods is most strongly influenced by which of the following?
- producer expectations,
- price of related goods,
- resource prices,
- number of sellers in the market.
- True/False: Decreases in both prices of the products included in a budget line do not shift that budget line.
- true,
- false,
- no valid answer.
- In the indifference map, equilibrium occurs where the indifference curve is
- tangent to the budget line,
- at its minimum point,
- intersected by the budget line,
- at its maximum point.
- When the quantity demanded of a good increases, its price is most likely to ............ .
- increase,
- decrease,
- remain unchanged.
- An indifference curve represents
- purchasing patterns from two different suppliers,
- what two individuals would be willing to trade,
- how purchases are unaffected by prices,
- combinations of two goods giving identical satisfaction.
- True/False: The law of supply proves there is no relationship between price and the quantity of a good supplied.
- true,
- false,
- no valid answer.
- True/False: Technological improvements in the production of goods may result in a increase in quantity supplied and a lower selling price.
- true,
- false,
- no valid answer.
- Which of the following is not an explanation of the law of demand
- substitution effect,
- diminishing marginal utility,
- bargain sales attitude,
- tastes change through time.
- Which of the following statements is false concerning the marginal rate of substitution?
- it verifies that indifference curves are concave as viewed from the origin,
- it indicates a consumer's willingness to substitute goods,
- it is the slope of the tangent to an indifference curve,
- all of the answers are correct.
- True/False: Indifference curves are used to explain consumer behavior.
- true,
- false,
- no valid answer.
- When more buyers enter a market, prices tend to ............ .
- increase,
- decrease,
- remain the same.
- Which of the following pairs is most likely to be made of substitutes?
- tea and sugar,
- bread and butter,
- bus and subway,
- hat and glove.
- True/False: More goods are supplied at higher prices than at lower prices.
- true,
- false,
- no valid answer.
- A milk price support higher than the free market equilibrium price results in
- more demand than supply,
- recurring surplus,
- periodic shortage,
- droughts affecting supply.
- True/False: An inverse relationship exists between the demand for substitute goods and changes in income.
- true,
- false,
- no valid answer.
- An inverse relationship between price and quantity is stated in the law of
- demand;
- supply;
- diminishing returns;
- mutual attraction.
- A shortage is present when which of the following occurs?
- price above equilibrium,
- supply exceeds demand,
- price below equilibrium,
- a government price support is present.
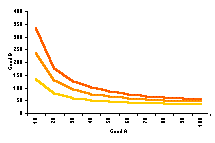
- Which of the above figures shows the presence market equilibrium?
- Figure A
-
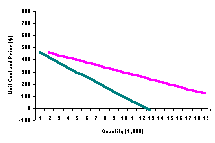
Figure B
-
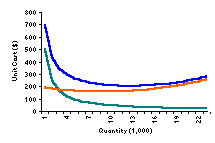
Figure C
-
Figure D
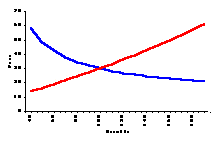
- Figure A
- The demand for ........ goods varies inversely with income.
- The name given to the observable occurrence which leads buyers to buy more of the items which have just been reduced in price, while cutting on their purchases of the items which remained at old prices, is ............. effect.
Answer
- C
- B
- A
- A
- D
- B
- A
- D
- A
- A
- A
- C
- A
- B
- B
- A
- C
- D
- INFERIOR
- SUBSTITUTION
Assignment
- Define demand. State the law of demand. Draw a demand curve and give reasons for the validity of your graph.
- Define supply. State the law of supply. Draw a supply curve and give reasons for the validity of your graph.
- Draw demand and supply in a graph, and prove that their intersection is a stable equilibrium point. In the process define surplus and shortage.
- Distinguish between changes in quantity demanded and changes in demand. List and explain nonprice determinants of demand.
- 3615 reads
