


In the preceding projections for the proposed ice cream bar venture, the assumption was that 36,000 ice cream bars would be sold based on the volume in the prior summer. However, the actual volume for a future venture might be higher or lower. And with an economic profit so close to zero, our students should consider the impact of any such differences. There is a relationship between the volume or quantity created and sold and the resulting impact on revenue, cost, and profit. These relationships are called the revenue function, cost function, and profit function. These relationships can be expressed in terms of tables, graphs, or algebraic equations. In a case where a business sells one kind of product or service, revenue is the product of the price per unit times the number of units sold. If we assume ice cream bars will be sold for $1.50 apiece, the equation for the revenue function will be
R = $1.5 Q,
where R is the revenue and Q is the number of units sold. The cost function for the ice cream bar venture has two components: the fixed cost component of $40,000 that remains the same regardless of the volume of units and the variable cost component of $0.30 times the number of items. The equation for the cost function is
C = $40,000 + $0.3 Q,
where C is the total cost. Note we are measuring economic cost, not accounting cost. Since profit is the difference between revenue and cost, the profit functions will be
π = R − C= $1.2 Q − $40,000.
Here π is used as the symbol for profit. (The letter P is reserved for use later as a symbol for price.)
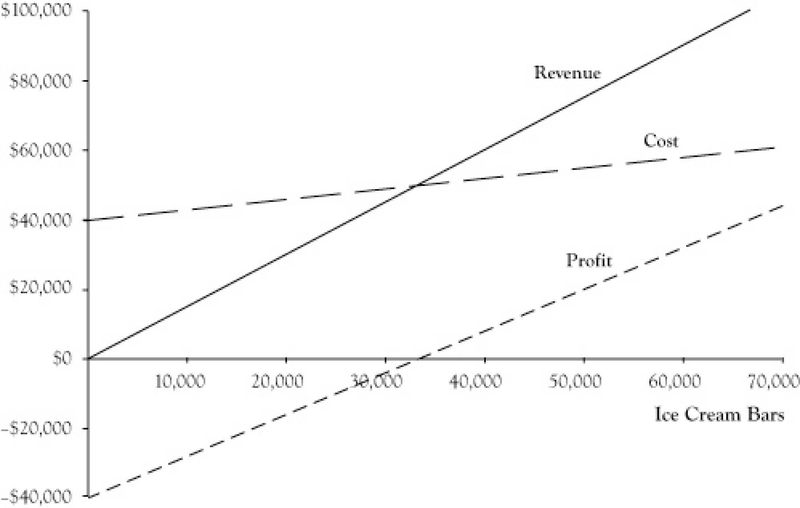
Table 2.1 Revenue, Cost, and Profit for Selected Sales Volumes for Ice Cream Bar Ventureprovides actual values for revenue, cost, and profit for selected values of the volume quantity Q. Figure 2.1, provides graphs of the revenue, cost, and profit functions.
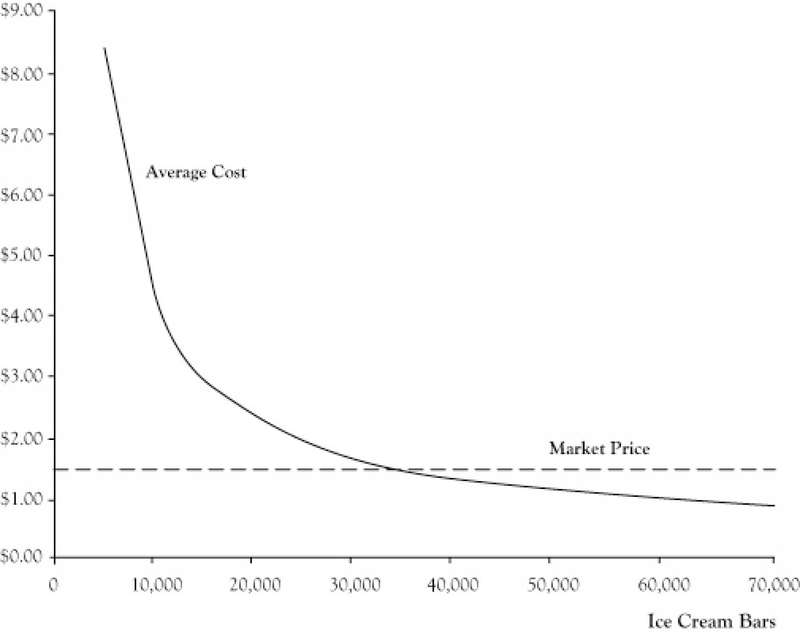
The average cost is another interesting measure to track. This is calculated by dividing the total cost by the quantity. The relationship between average cost and quantity is the average cost function. For the ice cream bar venture, the equation for this function would be
AC = C/Q = ($40,000 + $0.3 Q)/Q = $0.3 + $40,000/Q.
Figure 2.2shows a graph of the average cost function. Note that the average cost function starts out very high but drops quickly and levels off.
|
Units |
Revenue |
Cost |
Profit |
|---|---|---|---|
|
0 |
$0 |
$40,000 |
–$40,000 |
|
10,000 |
$15,000 |
$43,000 |
–$28,000 |
|
20,000 |
$30,000 |
$46,000 |
–$16,000 |
|
30,000 |
$45,000 |
$49,000 |
–$4,000 |
|
40,000 |
$60,000 |
$52,000 |
$8,000 |
|
50,000 |
$75,000 |
$55,000 |
$20,000 |
|
60,000 |
$90,000 |
$58,000 |
$32,000 |
Essentially the average cost function is the variable cost per unit of $0.30 plus a portion of the fixed cost allocated across all units. For low volumes, there are few units to spread the fixed cost, so the average cost is very high. However, as the volume gets large, the fixed cost impact on average cost becomes small and is dominated by the variable cost component.
- 4356 reads
