


Why are we so concerned about this “bathtub behavior” that all resources follow? Remember the problem we set out to solve, namely, what determines performance through time and how management affect performance in the future can. The logic is simple:
- The resources in place drive performance at every moment.
- Therefore we must know how the quantity of each resource changes through time.
- These quantities are only explained by their inflows and outflows.
- Thus to manage performance through time, the only way of exerting control is by managing the flows of resources into and out of the system.
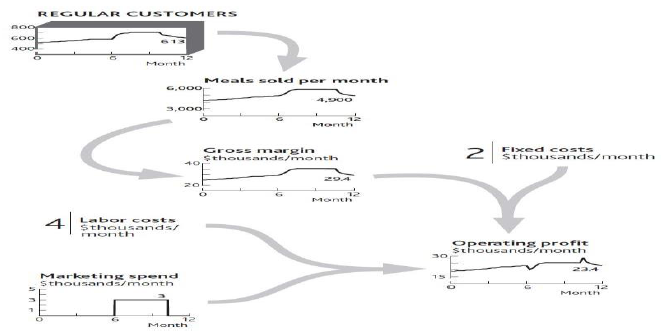
Consider your restaurant and see how these connections work (Figure 3.4 ). In Resources: Vital Drivers of Performance we looked at how the number of meals sold and the operating profits had changed during the previous 12 months and showed how these figures were driven by the number of customers and staff. Following the same logic, we next need to know what happened to customers and staff to bring about the performance history in Figure 2.1 and the inflows and outflows to these two resources.
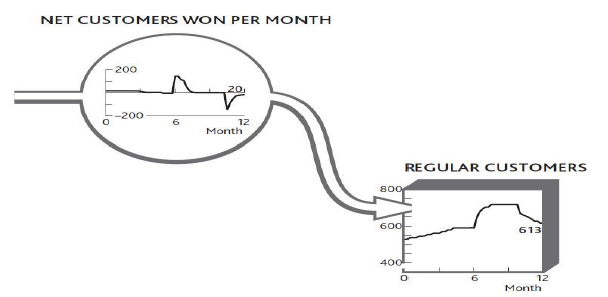
It is crucial to explain why the resource of customers developed over time as it did, and the only way to do this is to understand the flows (Figure 3.5).
Doing It Right: Units for Resources and Flows
Figure 3.2 and Figure 3.3 label the flows entering and leaving the customer resource as “Customers won/lost during the month.” This is always the relationship between resources and the flows that fill or drain them: Whatever the resource in the tank, the flows are “[resource] per [time period].”
There is never any exception to this rule!
- It looks as if you had an early small inflow of customers, but this slowed.
- So you did some serious marketing, which brought a flood of customers.
- But this soon died away again, and your customer stock settled down at a steady but higher level, with seemingly no inflow or outflow at all.
- Toward the end of the year, you experienced another flood of customers, but this time it was negative (the downward slope on the customer flow): You were losing customers fast.
- Once again the flood soon slowed to a mere trickle and your stock of customers steadied at a lower level, again apparently with no inflow or outflow.
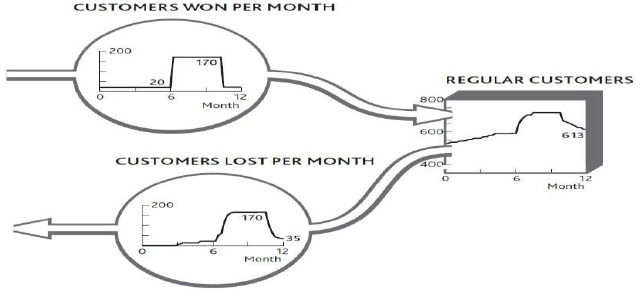
You can put flesh on these bones. By asking your customers if and when they have previously visited, you get a good idea of the inflow rate. Although you cannot easily ask how many people become ex-customers each month (because they are not there to be asked!), you can work out what the outflow must have been to reconcile with the net change each month (Figure 3.6).
Doing It Right: Separating Inflows From Outflows
If your restaurant experienced only the flows shown in Figure 3.5, you might be tempted to take the complacent view that nothing much is happening. Apart from the two puzzling spikes of customer gains around month 7 and losses around month 11, everything seems to be ticking along steadily enough.
But appearances are misleading. During the middle period, turbulent activity is taking place, with lots of customers arriving and many others leaving. In fact, customer churn is so rapid that by months 9 and 10, you are almost certainly losing many of the customers that your marketing efforts brought in just a short time before.
The factors driving resource gains are typically quite different from those driving losses, so you stand little chance of solving these challenges without distinguishing between the two flows.
Always try to identify resource “gain” and “loss” rates separately.
- 3225 reads
