


Why Has Performance Followed a Particular Path?
Earlier chapters have given us all the elements we need to develop a complete picture of our business, together with the information that explains why it has performed as it has up to now. These pieces are as follows:
- the time chart of one or more performance measures (e.g., profits, sales, service levels), with scale and timing
- the list of likely resources involved (e.g., customers, clients, staff, products, services, cash, capacity)
- the chain of immediate causes for that performance, often with simple arithmetical relationships (e.g., gross margin, revenue, labor costs, customer demand) at the head of those causal chains,
- the resources driving demand, supply, and performance (e.g., customers, staff, products, services, cash)
- the flows of resource (e.g., customers won and lost per month; staff hired, promoted, or leaving per month; products added or discontinued per year) into, though, and out of the organization’s system
- the immediate causes of these rates of flow, whether your own decisions or other factors
- the dependence of each resource flow on existing resources, either for the same resource or others
To illustrate these stages, let us go back to the performance of your restaurant that you wanted to understand before deciding what to do next. Start by pulling the pieces together.
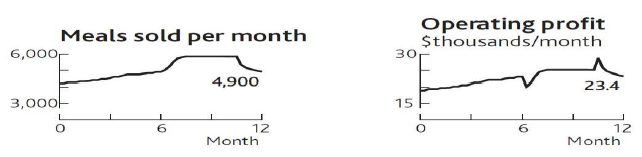
1.The time chart of one or more performance measures, with scale and timing (Figure 1.4 ).
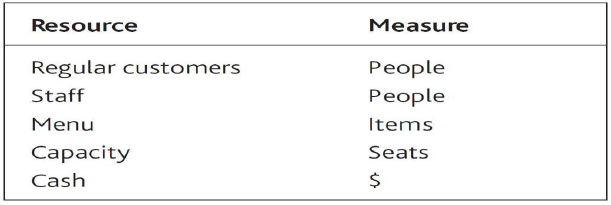
2. The list of likely resources involved. (Note: Not all of these may be needed to tackle a specific challenge. Subsequent stages will identify those that are involved.)
3.The immediate causes of that performance (Figure 2.1).
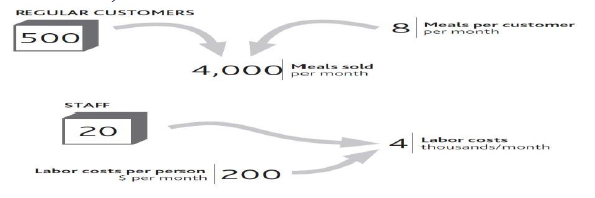
4. The resources driving demand, supply, and performance (Figure 2.2).
5. The flows of resources into, though, and out of the organization’s system (Figure 3.6).
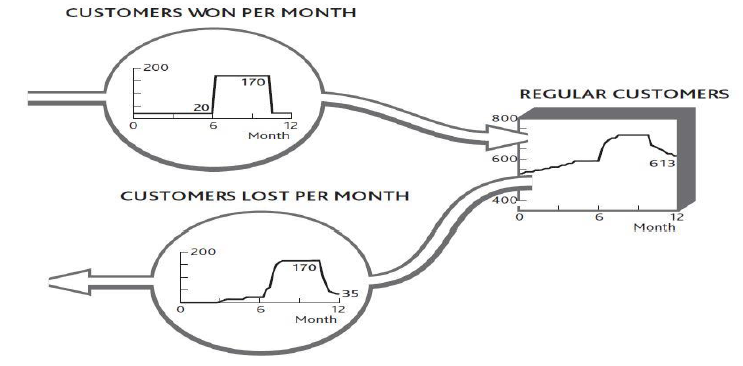
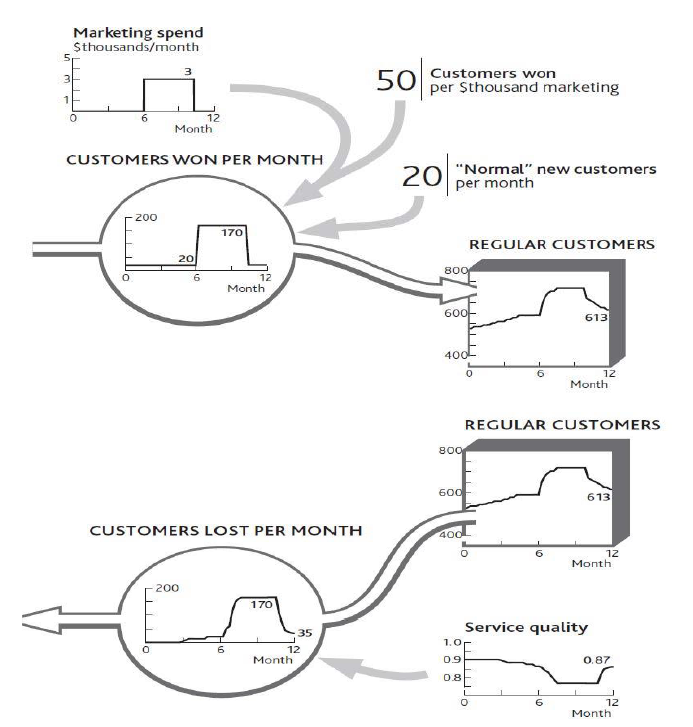
6. The immediate causes for these flows to be running at the rate they are (a) why customers are being won (Figure 4.1). (b) why customers are being lost (extended version of Figure : "The History of Service Quality and Customer Losses" ).
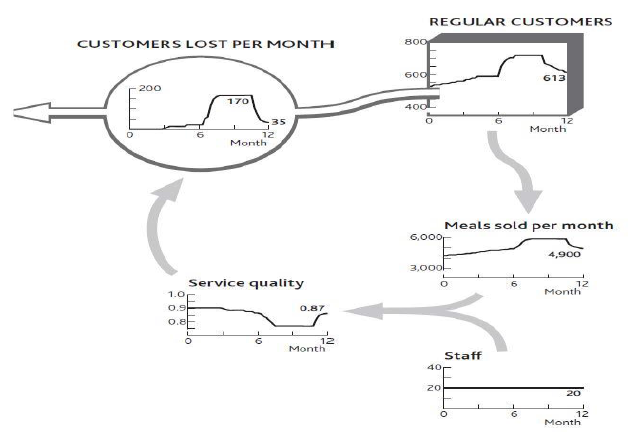
7. The dependence of each flow on existing resource levels (Figure 4.9).
Doing It Right: Do Not Try to Do Everything
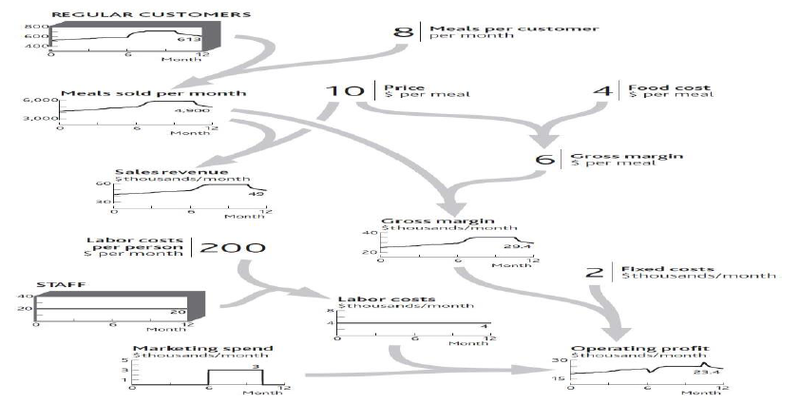
Figure 5.8 is far from a complete architecture of your restaurant. It does not, for example, include certain resources, such as the menu or the seating capacity. Nor does it include potentially important factors that could drive changes in performance, such as price or competitors’ actions. The best approach is to include as much of the architecture as is necessary to create a plausible explanation of performance over time.
This needs great care!
- First, do not do unnecessary work, such as collecting data on things that are not relevant. Keep the pictures to a minimum, so you can show people what is happening and why.
- Conversely, check you do not leave out factors that are (or could be) important. This is especially tricky when looking forward rather than just trying to explain the past.
- Finally, when you have an architecture that explains performance, ask whether you have missed anything that may be important to the question you set out to answer.
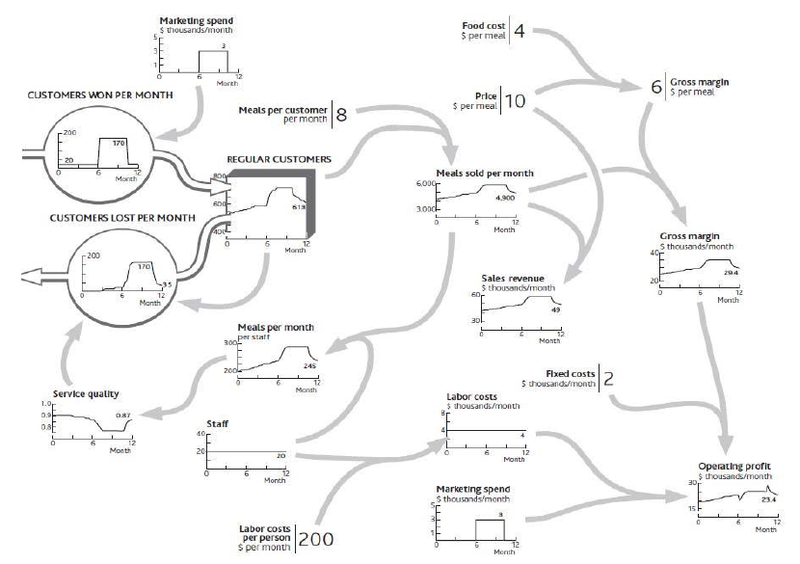
These elements connect together to provide a complete explanation of recent performance and future challenges (Figure 5.8).
- 瀏覽次數:2718
