


We now return to the other class of interdependence between resources, where an inadequate quantity of one resource slows and stops the growth of others. We can illustrate this by returning to the example of your restaurant.
Figure 3.4 showed a slowdown in customer growth, which even your strong marketing efforts failed to increase for more than a short time. Figure 3.6 explained separately the inflows and outflows that led to this. The questions we are left with are (a) Why did your customer growth stall in the early months? and (b) Why did customers leave in such high numbers from August through November? The clue lies in what happened to staff numbers during the year: nothing! You had 20 staff members throughout.
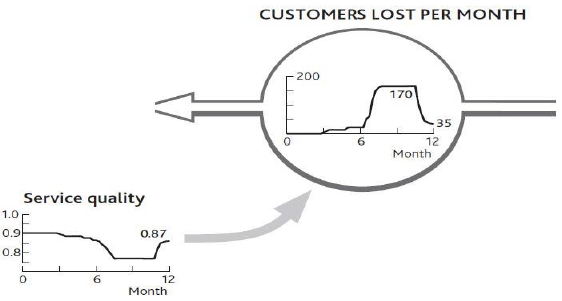
Customer numbers were fairly stable until you did your big marketing push, although by June you were losing nearly as many customers each month as you were gaining. It seems that your staffs were at the limit of their ability to cope. This is borne out by the information on customer service quality shown in Figure 4.8 . When service quality was high, customer losses were low, but when service quality took a dive, customer losses shot up.
Data on service quality, by the way, are not hard to estimate, even if you do not research them scientifically. Staff tips, complaints, and customer comment cards all offer simple information from which to estimate service quality. The resulting numbers may not be precise, but they are good enough to explain what’s happening and guide corrective action.
So now we can pursue the causal linkages and ask why service quality suffered. It seems your staff could only cope with the 4,000 meals per month bought by your original 500 customers. When sales jumped to well over 5,500 per month thanks to your marketing efforts, service quality dropped sharply: Your resources were badly out of balance.
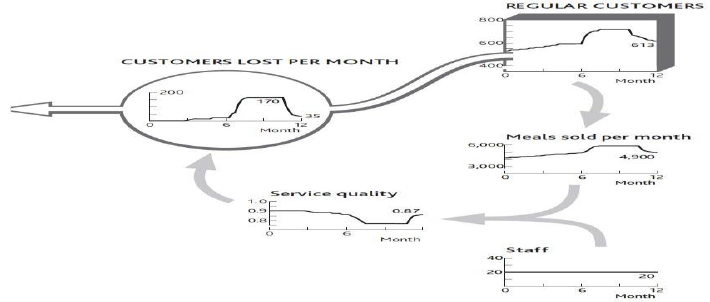
If we connect parts of Figure 3.5 with Figure 4.8, we can see how this story played out (Figure 4.9) and explain what happened to your restaurant over the past year.
- Early on, a small number of new customers were arriving in your restaurant every month.
- By the middle of the year, service quality had dropped a little—just enough to put some customers off (the small outflow rate shown in months 4 to 6).
- Your marketing campaign in July brought in a rapid flow of new customers: up to 170 per month.
- But your staff could not cope, and customers started leaving more rapidly.
- In a short time, customer losses caused by poor service matched the fast rate of customers brought in by your marketing.
- When you gave up the marketing effort, customer losses continued until they reached a level that where your staff could cope.
There are always limits to how far this cycle of reinforcing growth can go. Balancing mechanisms set in at some point: either you run out of potential resource or you run up against constraints caused by finite levels of other resources. Such balancing feedback structures can also be discovered by tracing back what is causing any resource flow to run at the rate it is. Detecting and managing these balancing effects can remove brakes on growth and protect organizations against overshoot or runaway collapse.
Action Checklist: Understanding and Leveraging Interdependence
Here are some tips for analyzing the interdependence between resources and using your resulting understanding to manage their development:
- Start with a chart of the history of a resource whose growth you want to understand and control.
- Identify, separately, the history of its inflows and outflows. You may have to do some investigation and reasoning. If, for example, you know your historic staff numbers, the change from month to month is the net inflow. You may not know the loss rate. However, you may know the hiring rate; in which case the loss rate is the difference between this hiring history and the history of net staff changes.
- The key variables you now want to explain are these separate inflows and outflows.
- Discuss the most likely factors driving a flow and find or estimate how these have changed over the same history. How many new staff did you try to hire month by month, and how many did you succeed in hiring? (Target hiring is clearly likely to influence actual hiring!) How have you changed starting salaries, for example, and how have your competitors’ starting salaries moved?
It is possible that putting the history charts for these items around the flow you want to explain will clarify sufficiently what has been happening and why. But it may be necessary to go further:
- Use statistical methods to see if your proposed explanations actually explain the resource flow rate.
- ff your initial list of causes does not seem to explain how resource flows have changed, go back and investigate what might be missing.
- When you are reasonably confident in your explanations for the resource flow you want to manage, work back to explanations for each of these factors in turn. Staff pressure, for example, will reflect total workloads divided by staff available.
Eventually, you will get back to existing resources, and you will have completed the chain of interdependence. Staff turnover will perhaps be explained by current number of customers (driving workload) and existing number of staff. You can now work around all these explanations for the resource flow with your colleagues and assess the likely effectiveness of any options that may be available to manage that flow into the future.
- 2857 reads
