


Available under Creative Commons-ShareAlike 4.0 International License.
Edit the script created in the example above to look like the code below:
    %% This file creates vectors, displays results and plots an x-y graph
x = [0:6];  % Create a row vector
y = 1.6*x;  % Compute y as a function of x
%% Tabulated data
[x',y']    % Transpose vectors x and y
%% Graph of y=f(x)
plot(x,y),title('Graph of y=f(x)'),xlabel('x'),ylabel('f(x)'),grid % Plot a graph
Save the script, a new HTML file is generated as shown in the figure below:
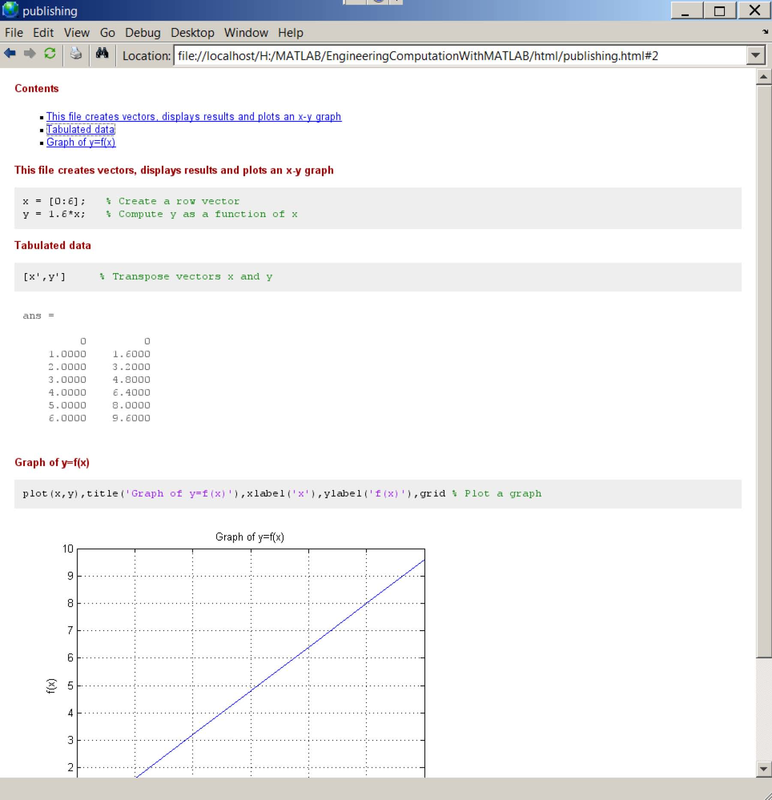
Figure 8.4 An html file with sections
- 瀏覽次數:1753
