


Available under Creative Commons-ShareAlike 4.0 International License.
The m-file content:
% This script plots a graph of Graph of y=sin(x)/x
clc                      % Clear screen
x = pi/100:pi/100:10*pi; % Create a row vector
y = sin(x)./x;           % Calculate y as function of x
plot(x,y),title('Graph of y=sin(x)/x'),xlabel('x'),ylabel('y'),grid
The html output:
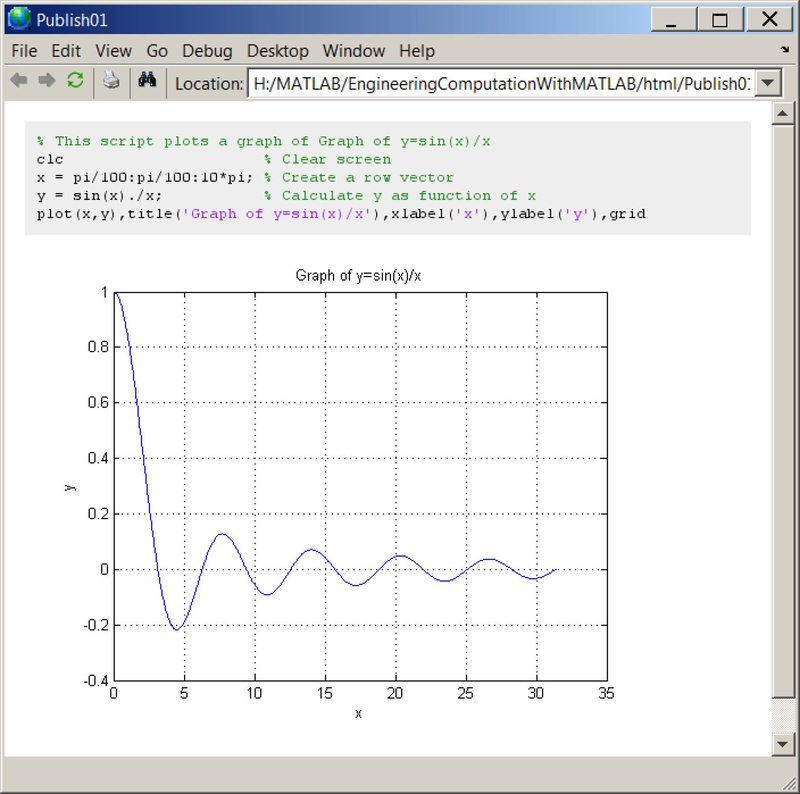
Figure 8.5 The published html file.
- 瀏覽次數:1866
