


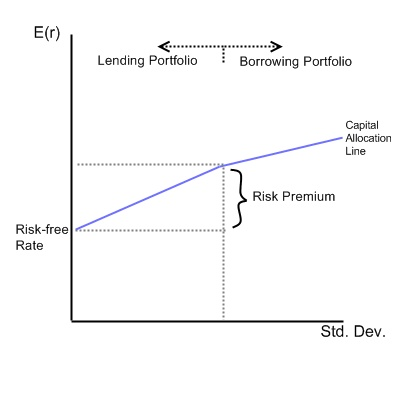
The Capital Allocation Line shows how an investor can use an optimal market portfolio matched to his risk preferences. According to capital market theory, there is one particular portfolio that has the highest expected returns for its risk. However, the risk category that this portfolio is in may not be suitable for all investors. Some investors will naturally prefer lower risk, lower return securities. Other investors will prefer riskier ventures with the possibility of higher returns. The Capital Allocation Line is kinked at one point in the middle, this represents the optimal market portfolio.
The line slopes down and to the left from this point. All of the points on this left half of the line represent a lending portfolio. A lending portfolio consists of the market portfolio, plus some risk free government securities. These securities serve to reduce the risk profile of the portfolio, while of course also reducing expected returns.
The line slopes up and to the right from the point in the middle. Every point on the right half of the line represents a borrowing portfolio. This shows how an investor can buy the market portfolio, and also borrow money in order to buy more of the market portfolio. Therefore, an investor can hold the same market portfolio and increase his risk and expected return. Notice that the slope of the lending portfolio is higher than that of the borrowing portfolio. This is because the rate at which one can borrow money will always be higher than the risk free lending rate.
- 瀏覽次數:3840
