


How Have We Come to This Position?
A strategic architecture provides a living reference for a firm’s structure and behavior. A critical part of top management’s job is to understand that structure, ensure that it is well designed, and steer its performance (Keough & Doman, 1992). Diagrams such as Figure 5.8 are a common way of understanding and controlling complex systems. Even if you have never visited a chemicals plant or power station, flown an aircraft, or managed a rail network, you will have seen pictures of “control panels” that give management continuous information on the states of key variables. Their control panels look like the system they are managing.
We are trying to achieve the same analog-style diagram for your organization. To make best use of such a picture, you need to have it available and accessible to your whole team, perhaps on a large wallboard in the main meeting room. It may be helpful to have other diagrams in other meeting rooms to show more detail about the architecture of key parts of the system: a diagram of customer segment details in the marketing area, a diagram of people flows in the human resource (HR) department, and so on.
You may not get it right the first time. However, any inaccuracies will become apparent as you learn whether the relationships you have sketched between the connected data provide a good explanation of what is happening. If not, you can readily identify what may be missing or inaccurate and revise the architecture diagram accordingly.
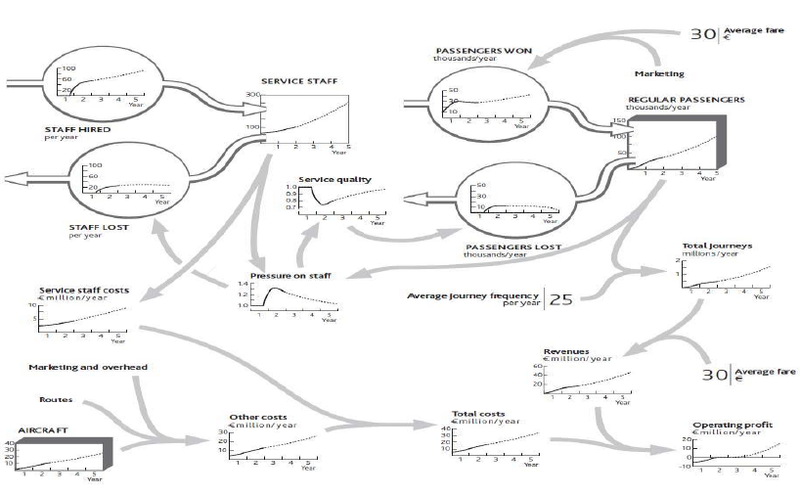
A well-developed strategic architecture is a powerful tool, both to resolve specific issues and to guide the performance of the entire enterprise strategy. To understand this, consider a rather more extensive example than your restaurant: the architecture of a low-fare airline (similar to Ryanair, which is featured in Resources: Vital Drivers of Performance ). Figure 5.9 shows the first 2 years of operation, followed by a possible 3-year future, denoted by the dotted portion of the lines.
Doing It Right: Whole Numbers
The chart for aircraft in this example shows a smooth line, even though this resource comes in batches; operating 7.5 planes, as it seems you did at one point in year 2, does not make sense. Strictly, we should have a stepped chart over time for aircraft, with a jump to a new number each time a batch of ordered aircraft is received. But for a strategic view of what is happening you do not need to worry about this picky detail.
It looks complicated, but if you take it in sections, you can see how the stages come together:
- Issues of concern by the end of year 2 are operating profit (bottom right), which seems to have stalled, and total journeys (middle right), where growth has slowed.
- The core resources are aircraft, passengers, and staff (routes, too, but we can add these later).
- The immediate factors driving operating profits can be traced back through revenues to total journeys, and through total costs to staff and other cost drivers (in practice, these would be split further).
- The flows of resources into, though, and out of the organization’s system are the gains and losses of passengers, the hiring and loss of staff, and the acquisition of planes. Since buying and selling planes is a simple decision, directly under management control, we do not need to show that on the diagram.
- The problematic flows are the loss of passengers, which appears to be due to a sharp drop in service quality, and the loss of staff, which arose from a steep increase in work pressure.
- The pressure on staff appears to be due to the imbalance between passenger volumes and staff numbers.
- The entire picture explains recent history. Growth in passengers and journeys exceeded the staff’s ability to cope, causing them to leave and thus damaging service quality, which in turn increased the loss of passengers.
Valuable insights can arise simply from the team activity involved in developing this picture, as it will typically prompt substantial debate and analysis. Two elements will ensure that insights are accurate and address the correct issues:
- The time charts for core resources, flow drivers, and performance keep discussion focused on the best-known facts of the situation. Do not give up if you do not know precise data; instead, estimate what the facts might have been, then use judgment to fill in unknowns. For example, you may not have records of staff attrition rates, but if you know hiring rates and total staff numbers, the history of attrition is easy to calculate.
- You will have quantified how each resource flow depends on the factors driving it. Again, if you do not know for sure what is happening, think through your best explanation and check that it fits with the facts. Do not tolerate unsubstantiated assertions like “Everyone knows staff are leaving because our competitor offers better pay” unless there is factual evidence to back it up.
Where Is Performance Heading if We Go on Like This?
Figure 5.9 goes further than explaining recent history. It sketches out the team’s best estimate of where performance is heading into the future. The dashed lines show the estimate that you and your team came up with about the way things are likely to develop if you continue with present policies.
How Can We Act to Improve Future Performance?
The strategic architecture you develop will enable your team to evaluate a range of possible future strategies—the final stage of the process. You again need an organized approach:
- Start with the points in the business architecture where step 6 showed the challenge to lie: where flows are not running as you would like.
- Focus on the links into that part of the architecture that management can influence. For the airline inFigure 5.9 , these would be price changes, marketing, and hiring.
- Estimate the scale of policy revision and the likely scale and timing of its results. For example, if you cut fares by 10%, how much would the passenger win rate change? If you double the hiring rate, how quickly will staff numbers rise to your target level?
- Follow the consequences of these policy changes. If you cut fares and bring in more passengers, how much will this change total journeys and pressure on staff? How much impact will this have on passenger losses and staff turnover? If you boost hiring, how much will that change pressure on staff, and what impacts will that have on passenger losses and staff turnover?
- Anticipate any issues that might arise from altering the part of the system where the current problem is focused. Cutting your fares will clearly cut revenue per journey, and increasing staff will increase costs, both resulting in a short-term drop in profits. How long will it take before the improved resource flows you stimulated work through to generate revenues and profit improvements that overcome this short-term penalty?
- Finally, work through how any performance outcomes might evolve over time because of the proposed changes. The cut in fares might very quickly bring in more passengers and boost revenues and profits, although the further consequence would be increased workloads for staff, faster passenger losses, and hence a later decrease in passengers, journeys, revenues, and profits. Alternatively, increasing hiring should reduce the pressure staffs are under, reduce turnover, improve service quality, and cut passenger losses, thus increasing total passengers even if there is no change in passenger win rates. More passengers means more journeys and revenues, which will more than pay for the higher staff costs.
Let us work through an example. One of your colleagues believes that poor service quality is unacceptable: It risks building up a poor reputation among potential passengers, which could hurt future growth. This colleague feels you should immediately hire enough staff to remove the overload.
Together, your team works through what might happen (Figure 5.10). One risk in the proposed solution is that these newcomers will not know what they are doing at first, so they will be deployed on simple tasks, and hiring rates can be reduced for a while so they can acquire more skill. Your colleague feels that this simple step will immediately relieve some of the pressure and give your people the ability to improve service quality quickly—especially if you tell them that this is your plan!
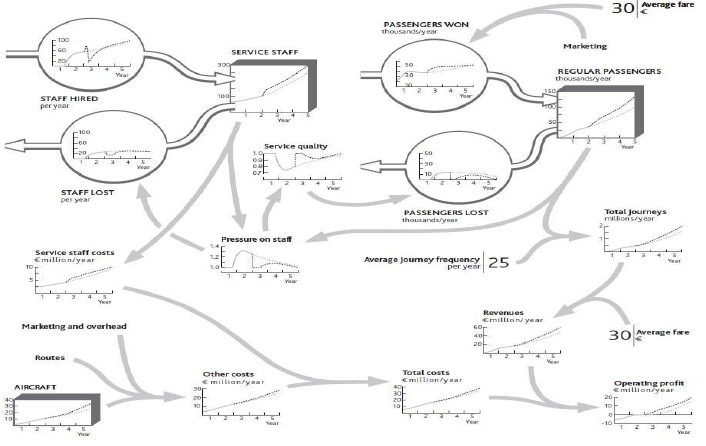
You are reasonably confident that the improvements to workload and quality will materialize, so you estimate that passenger growth will accelerate once more, provided you continue adding routes and aircraft. You feel there is a small risk that this will again put staff under pressure sometime during year 3. You resolve to keep track of this issue and revisit the hiring policy if it looks as though the problem is recurring.
- 3205 reads
