


Here’s an example that uses Lumpy to generate a state diagram.

from swampy.Lumpy import Lumpy

lumpy = Lumpy()
lumpy.make_reference()

message = 'And now for something completely different'
n = 17
pi = 3.1415926535897932

lumpy.object_diagram()
The first line imports the Lumpy class from swampy.Lumpy. If you don’t have Swampy installed as a package, make sure the Swampy files are in Python’s search path and use this import statement instead:
from Lumpy import Lumpy
The next lines create a Lumpy object and make a “reference” point, which means that Lumpy records the objects that have been defined so far.
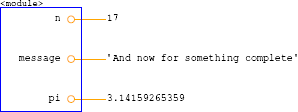
Next we define new variables and invoke object_diagram, which draws the objects that have been defined since the reference point, in this case message, n and pi.
Figure 19.3 shows the result. The graphical style is different from what I showed earlier; for example, each reference is represented by a circle next to the variable name and a line to the value. And long strings are truncated. But the information conveyed by the diagram is the same.
The variable names are in a frame labeled <module>, which indicates that these are module-level variables, also known as global.
You can download this example from http://thinkpython.com/code/lumpy_demo1.py. Try adding some additional assignments and see what the diagram looks like.
- 2586 reads
