


- The socket interface allows you to use the UDP protocol on a Unix host. UDP provides a connectionless
unreliable service that in theory allows you to send SDUs of up to 64 KBytes.
- Implement a small UDP client and a small UDP server (in python, you can start from the example provided in this site but you can also use C or java )
- run the client and the servers on different workstations to determine experimentally the largest SDU that is supported by your language and OS. If possible, use different languages and Operating Systems in each group.
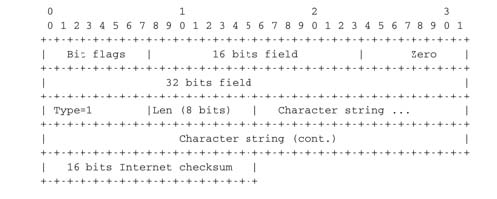
- By using the socket interface, implement on top of the connectionless unreliable service provided by UDP a simple client that sends the following message shown in the figure below.
Upon reception of a message, the server verifies that :
- the flag has the correct value
- the 32 bits integer is the square of the 16 bits integer
- the character string is an ASCII representation of the 32 bits integer
- the Internet checksum is correct
Your implementation must be able to run on both low endian and big endian machines. If you have access to different types of machines (e.g. x86 laptops and SPARC servers), try to run your implementation on both types of machines.
- The socket library is also used to develop applications above the reliable bytestream service provided by TCP. We have
installed on the cnp3.info.ucl.ac.be server a simple server that provides a simple client-server service. The service operates as follows :
- the server listens on port 62141 for a TCP connection
- upon the establishment of a TCP connection, the server sends an integer by using the following TLV format :
- the first two bits indicate the type of information (01 for ASCII, 10 for boolean)
- the next six bits indicate the length of the information (in bytes)
- An ASCII TLV has a variable length and the next bytes contain one ASCII character per byte. A boolean TLV has a length of one byte. The byte is set to 00000000b for true and 00000001b for false.
- the client replies by sending the received integer encoded as a 32 bits integer in network byte order
- the server returns a TLV containing true if the integer was correct and a TLV containing false otherwise and closes the TCP connection
- It is now time to implement a small transport protocol. The protocol uses a sliding window to transmit more than one segment without being forced to wait for an acknowledgment. Your implementation must support variable size sliding window as the other end of the fl ow can send its maximum window size. The window size is encoded as a three bits unsigned integer.
To deal with segments losses, the protocol must implement a recovery technique such as go-back-n or selective repeat and use retransmission timers. You can select the technique that best suite your needs and start from a simple technique that you improve later.

This segment format contains the following fields :
- Type: segment type
- 0x1 DATA segment.
- 0x2 ACK segment
- WIN: the size of the current window (an integer encoded as a 3 bits field). In DATA segments, this field indicates the size of the sending window of the sender. In ACK segments, this field indicates the current value of the receiving window.
- Sequence: Sequence number (8 bits unsigned integer), starts at 0. The sequence number is incremented by 1 for each new DATA segment sent by the sender. Inside an ACK segment, the sequence field carries the sequence number of the next in-sequence segment that is expected by the receiver.
- Length: length of the payload in multiple of one byte. All DATA segments contain a payload with 512 bytes of data, except the last DATA segment of a transfer that can be shorter. The reception of a DATA segment whose length is different than 512 indicates the end of the data transit.
- Payload: the data to send
The client and the server exchange UDP datagrams that contain the DATA and ACK segments. They must provide a command-line interface that allows to transmit one binary file and support the following parameters :
sender <destination_DNS_name> <destination_port_number> <window_size> <input_file> receiver <listening_port_number> <window_size> <output_file>
In order to test the reactions of your protocol against errors and losses, you you can use a random number generator to probabilistically drop received segments and introduce random delays upon the arrival of a segment.
Packet trace analysis
When debugging networking problems or to analyse performance problems, it is sometimes useful to capture the segments that are exchanged between two hosts and to analyse them.
Several packet trace analysis tools are available, either as commercial or open-source tools. These tools are able to capture all the packets exchanged on a link. Of course, capturing packets require administrator privileges. They can also analyse the content of the captured packets and display information about them. The captured packets can be stored in a file for offline analysis.
tcpdump is probably one of the most well known packet capture software. It is able to both capture packets and display their content. tcpdump is a text-based tool that can display the value of the most important fields of the captured packets. Additional information about tcpdumpmay be found in tcpdump(1). The text below is an example of the output of tcpdump for the first TCP segments exchanged on an scp transfer between two hosts.
21:05:56.230737 IP 192.168.1.101.54150 > 130.104.78.8.22: S 1385328972:1385328972(0) win 65535 <mss 21:05:56.251468 IP 130.104.78.8.22 > 192.168.1.101.54150: S 3627767479:3627767479(0) ack 1385328973 21:05:56.251560 IP 192.168.1.101.54150 > 130.104.78.8.22: . ack 1 win 65535 <nop,nop,timestamp 274527749 21:05:56.279137 IP 130.104.78.8.22 > 192.168.1.101.54150: P 1:21(20) ack 1 win 49248 <nop,nop,timestamp 21:05:56.279241 IP 192.168.1.101.54150 > 130.104.78.8.22: . ack 21 win 65535 <nop,nop,timestamp 21:05:56.279534 IP 192.168.1.101.54150 > 130.104.78.8.22: P 1:22(21) ack 21 win 65535 21:05:56.303527 IP 130.104.78.8.22 > 192.168.1.101.54150: . ack 22 win 49248 <nop,nop,timestamp 21:05:56.303623 IP 192.168.1.101.54150 > 130.104.78.8.22: P 22:814(792) ack 21 win 65535
You can easily recognise in the output above the SYN segment containing the MSS, window scale, timestamp and sackOK options, the SYN+ACK segment whose wscale option indicates that the server uses window scaling for this connection and then the first few segments exchanged on the connection.
wireshark is more recent than tcpdump. It evolved from the ethereal packet trace analysis software. It can be used as a text tool like tcpdump. For a TCP connection, wiresharkwould provide almost the same output as tcpdump. The main advantage of wireshark is that it also includes a graphical user interface that allows to perform various types of analysis on a packet trace.
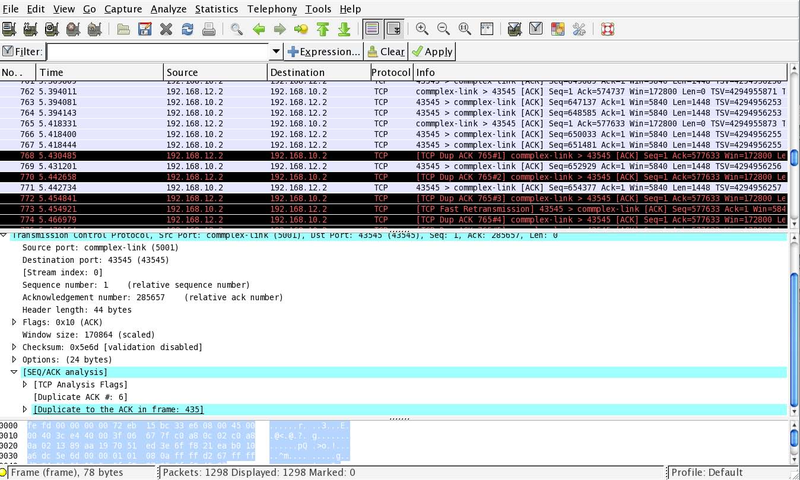
The wireshark window is divided in three parts. The top part of the window is a summary of the first packets from the trace. By clicking on one of the lines, you can show the detailed content of this packet in the middle part of the window. The middle of the window allows you to inspect all the fields of the captured packet. The bottom part of the window is the hexadecimal representation of the packet, with the field selected in the middle window being highlighted.
wiresharkis very good at displaying packets, but it also contains several analysis tools that can be very useful. The first tool is Follow TCP stream. It is part of the Analyze menu and allows you to reassemble and display all the payload exchanged during a TCP connection. This tool can be useful if you need to analyse for example the commands exchanged during a SMTP session.
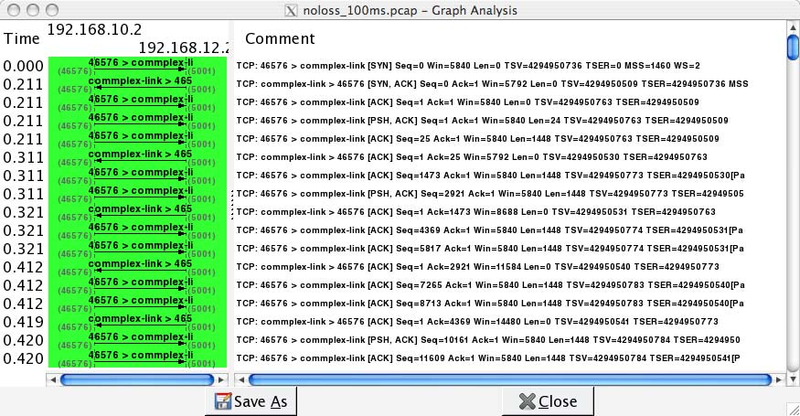
The second tool is the flow graph that is part of the Statistics menu. It provides a time sequence diagram of the packets exchanged with some comments about the packet contents. See blow for an example.
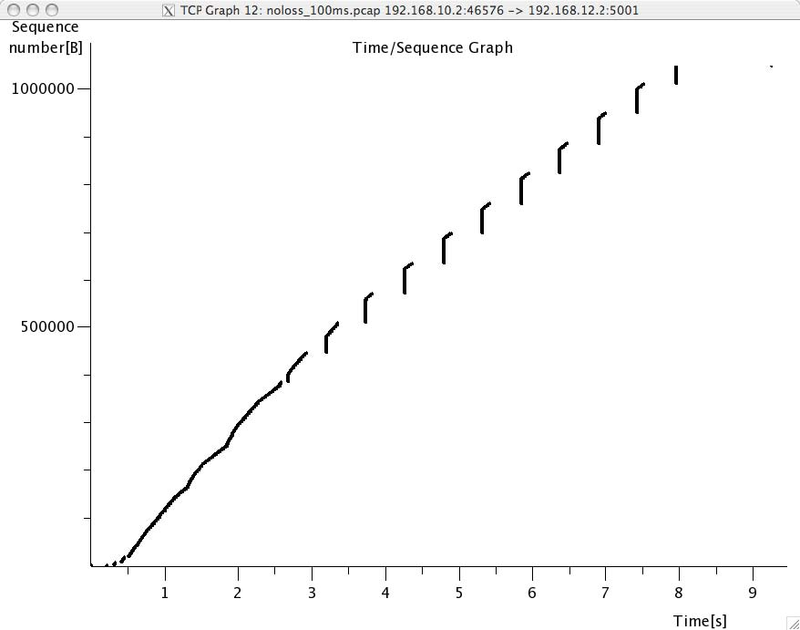
The third set of tools are the TCP stream graph tools that are part of the Statistics menu. These tools allow you to plot various types of information extracted from the segments exchanged during a TCP connection. A first interesting graph is the sequence number graph that shows the evolution of the sequence number field of the captured segments with time. This graph can be used to detect graphically retransmissions.
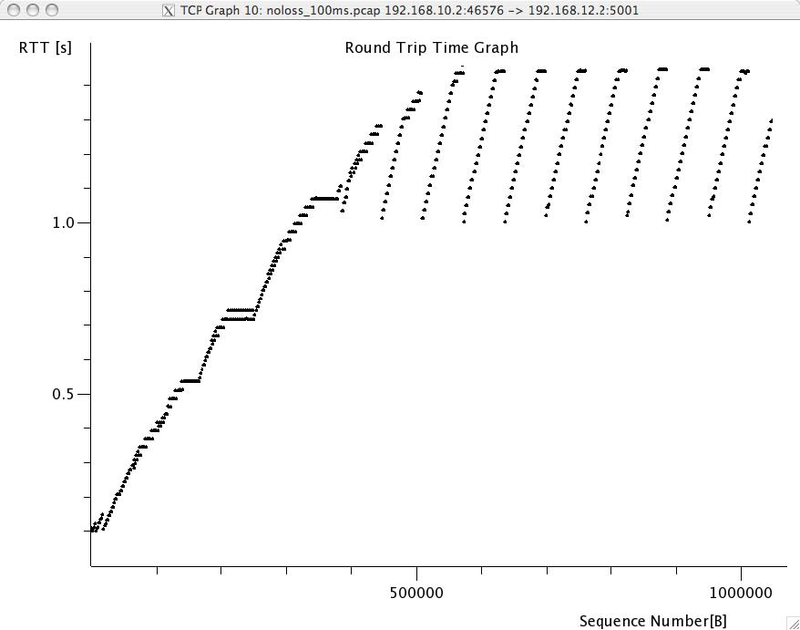
A second interesting graph is the round-trip-time graph that shows the evolution of the round-trip-time in function of time. This graph can be used to check whether the round-trip-time remains stable or not. Note that from a packet trace, wireshark can plot two round-trip-time graphs, One for the flow from the client to the server and the other one. wireshark will plot the round-trip-time graph that corresponds to the selected packet in the top wireshark window.
Emulating a network with netkit
Netkit is network emulator based on User Mode Linux. It allows to easily set up an emulated network of Linux machines, that can act as end-host or routers.
Netkit is available at http://www.netkit.org. Files can be downloaded from here, and instructions for the installations are available here.
There are two ways to use Netkit : The manual way, and by using pre-configured labs. In the first case, you boot and control each machine individually, using the commands starting with a “v” (for virtual machine). In the second case, you can start a whole network in a single operation. The commands for controlling the lab start with a “l”. The man pages of those commands is available from here.
You must be careful not to forgot to stop your virtual machines and labs, using either vhalt or lhalt.
A netkit lab is simply a directory containing at least a configuration file called lab.conf, and one directory for each virtual machine. In the case the lab available on iCampus, the network is composed of two pcs, pc1 and pc2, both of them being connected to a router r1. The lab.conf file contains the following lines :
pc1[0]=A pc2[0]=B r1[0]=A r1[1]=B
This means that pc1 and r1 are connected to a “virtual LAN” named A via their interface eth0, while pc2 and r1 are connected to the “virtual LAN” B via respectively their interfaces eth0 and eth1.
The directory of each device is initially empty, but will be used by Netkit to store their filesystem.
The lab directory can contain optional files. In the lab provided to you, the “pc1.startup” file contains the shell instructions to be executed on startup of the virtual machine. In this specific case, the script configures the interface eth0 to allow traffic exchanges between pc1 and r1, as well as the routing table entry to join pc2.
Starting a lab consists thus simply in unpacking the provided archive, going into the lab directory and typing lstart to start the network.
Virtual machines can access to the directory of the lab they belong to. This repertory is mounted in their filesystem at the path /hostlab.
In the netkit lab (exercises/netkit/netkit_lab_2hosts_1rtr_ipv4.tar.tar.gz, you can find a simple python client/server application that establishes TCP connections. Feel free to re-use this code to perform your analysis.
As the virtual machines run Linux, standard networking tools such as hping, tcpdump, netstat etc. are available as usual.
Note that capturing network traces can be facilitated by using the uml_dump extension available here. This extension is already installed in the Netkit installation on the student lab. In order to capture the traffic exchanged on a given ‘virtual LAN’, you simply need to issue the command vdump <LAN name> on the host. If you want to pipe the trace to wireshark, you can use vdump A | wireshark -i -k
- A TCP/IP stack receives a SYN segment with the sequence number set to 1234. What will be the value of the acknowledgement number in the returned SYN+ACK segment ?
- Is it possible for a TCP/IP stack to return a SYN+ACK segment with the acknowledgement number set to 0 ? If no, explain why. If yes, what was the content of the received SYN segment.
- Open the tcpdump packet trace exercises/traces/trace.5connections_opening_closing.pcap and identify the number of different TCP connections that are established and closed. For each connection, explain by which mechanism they are closed. Analyse the initial sequence numbers that are used in the SYN and SYN+ACK segments. How do these initial sequence numbers evolve ? Are they increased every 4 microseconds ?
- The tcpdump packet trace exercises/traces/trace.5connections.pcap contains several connection attempts. Can you explain what is happening with these connection attempts ?
- The tcpdump packet trace exercises/traces/trace.ipv6.google.com.pcap was collected from a popular website that is accessible by using IPv6. Explain the TCP options that are supported by the client and the server.
- The tcpdumppacket trace exercises/traces/trace.sirius.info.ucl.ac.be.pcap Was collected on the departmental server. What are the TCP options supported by this server ?
- A TCP implementation maintains a Transmission Control Block (TCB) for each TCP connection. This TCB is a data structure that contains the complete “state” of each TCP connection. The TCB
is described in RFC 793. It contains first the identification of the TCP connection :
- localip : the IP address of the local host
- remoteip : the IP address of the remote host
- remoteport : the TCP port used for this connection on the remote host
- localport : the TCP port used for this connection on the local host. Note that when a client opens a TCP connection, the local port will often be chosen in the ephemeral port range ( 49152 <= localport <= 65535 ).
- sndnxt : the sequence number of the next byte in the byte stream (the first byte of a new data segment that you send will use this sequence number)
- snduna : the earliest sequence number that has been sent but has not yet been acknowledged
- rcvnxt : the sequence number of the next byte that your implementation expects to receive from the remote host. For this exercise, you do not need to maintain a receive buffer and your implementation can discard the out-of-sequence segments that it receives
- sndwnd : the current sending window
- rcvwnd : the current window advertised by the receiver
- Using the exercises/traces/trace.sirius.info.ucl.ac.be.pcap packet trace, what is the TCB of the connection on host 130.104.78.8 when it sends the third segment of the trace ?
- The tcpdump packet trace exercises/traces/trace.maps.google.com was collected by con taining a popular web site that provides mapping information. How many TCP connections were used to retrieve the information from this server ? Some network monitoring tools such as ntop collect all the TCP segments sent and received by a host or a group of hosts and provide interesting statistics such as the number of TCP connections, the number of bytes exchanged over each TCP connection, ... Assuming that you can capture all the TCP segments sent by a host, propose the pseudo-code of an application that would list all the TCP connections established and accepted by this host and the number of bytes exchanged over each connection. Do you need to count the number of bytes contained inside each segment to report the number of bytes exchanged over each TCP connection ?
- There are two types of firewalls: special devices that are placed at the border of campus or enterprise networks and software that runs on endhosts. Software firewalls typically analyse all the packets that are received by a host and decide based on the packet’s header and contents whether it can be processed by the host’s network stack or must be discarded. System administrators often configure firewalls on laptop or student machines to prevent students from installing servers on their machines. How would you design a simple firewall that blocks all incoming TCP connections but still allows the host to establish TCP connections to any remote server ?
- Using the netkit lab explained above, perform some tests by using hping3(8). hping3(8) is a com mand line tool that allows anyone (having system administrator privileges) to send special IP packets and TCP segments. hping3(8) can be used to verify the configuration of firewalls 33 or diagnose problems. We will use it to test the operation of the Linux TCP stack running inside netkit.
- On the server host, launch tcpdump(1) with -vv as parameter to collect all packets received from the client and display them. Using hping3(8) on the client host, send a valid SYN segment to one unused port on the server host (e.g. 12345). What are the contents of the segment returned by the server ?
- Perform the same experiment, but now send a SYN segment towards port 7. This port is the default port for the discard service (see services(5)) launched by xinetd(8)). What segment does the server sends in reply ? What happens upon reception of this segment ? Explain your answer.
- The Linux TCP/IP stack can be easily configured by using sysctl(8) to change kernel configuration variables. See here for a recent list of the sysctl variables on the Linux TCP/IP stack. Try to disable the selective acknowledgements and the RFC1323 timestamp and large window options and open a TCP connection on port 7 on the server by using :manpage:telnet‘(1)‘. Check by using tcpdump(1) the effect of these kernel variables on the segments sent by the Linux stack in netkit.
- Network administrators sometimes need to verify which networking daemons are active on a server. When logged on the server, several tools can be used to verify this. A first solution is
to use the netstat(8) command. This command allows you to extract various statistics from the networking stack on the Linux kernel. For TCP, netstat can list all the active TCP connections
with the state of their FSM. netstat supports the following options that could be useful during this exercises:
- -t requests information about the TCP connections
- -n requests numeric output (by default, netstat sends DNS queries to resolve IP addresses in hosts and uses /etc/services to convert port number in service names, -n is recommended on netkit machines)
- -e provides more information about the state of the TCP connections
- -o provides information about the timers
- -a provides information about all TCP connections, not only those in the Established state
On the netkit lab, launch a daemon and start a TCP connection by using telnet(1) and use netstat(8) to verify the state of these connections.
A second solution to determine which network daemons are running on a server is to use a tool like nmap(1). nmap(1) can be run remotely and thus can provide information about a host on which the system administrator cannot login. Use tcpdump(1) to collect the segments sent by nmap(1) running on the client and explain how nmap(1) operates.
- Long lived TCP connections are susceptible to the so-called RST attacks. Try to find additional information about this attack and explain how a TCP stack could mitigate such attacks.
- For the exercises below, we have performed measurements in an emulated 1 network similar to the one shown below.

We used netem to collect several traces :
- exercises/traces/trace0.pcap
- exercises/traces/trace1.pcap
- exercises/traces/trace2.pcap
- exercises/traces/trace3.pcap
- Identify the TCP options that have been used on the TCP connection
- Try to find explanations for the evolution of the round-trip-time on each of these TCP connections. For this, you can use the round-trip-time graph of wireshark, but be careful with their estimation as some versions of wireshark are buggy
- Verify whether the TCP implementation used implemented delayed acknowledgements
- Inside each packet trace, find :
- one segment that has been retransmitted by using fast retransmit. Explain this retransmission in details.
- one segment that has been retransmitted thanks to the expiration of TCP’s retransmission timeout. Explain why this segment could not have been retransmitted by using fast retransmit.
- wireshark contains several two useful graphs : the round-trip-time graph and the time sequence graph. Explain how you would compute the same graph from such a trace .
- When displaying TCP segments, recent versions of wireshark contain expert analysis heuristics that indicate whether the segment has been retransmitted, whether it is a duplicate ack or whether the retransmission timeout has expired. Explain how you would implement the same heuristics as wireshark.
- Can you find which file has been exchanged during the transfer ?
- You have been hired as an networking expert by a company. In this company, users of a networked application complain that the network is very slow. The developers of the application argue that any delays are caused by packet losses and a buggy network. The network administrator argues that the network works perfectly and that the delays perceived by the users are caused by the applications or the servers where the application is running. To resolve the case and determine whether the problem is due to the network or the server on which the application is running. The network administrator has collected a representative packet trace that you can download from exercises/traces/trace9.pcap. By looking at the trace, can you resolve this case and indicate whether the network or the application is the culprit ?
- 3997 reads
