


Available under Creative Commons-NonCommercial-ShareAlike 4.0 International License.
The law of demand is represented graphically by a downsloping curve showing that when price decreases, quantity increases and vice versa.
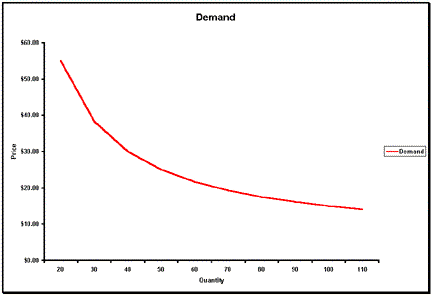
Figure 3.1 Demand
- 2441 reads
