


Now it is time to think about how all of this fits together and to see how the two approaches to correlation are related. Start by assuming that you have a population of (x, y) which covers a wide range of y-values, but only a narrow range of x-values. This means that σy is large while σx is small. Assume that you graph the (x, y) points and find that they all lie in a narrow band stretched linearly from bottom left to top right, so that the largest y's are paired with the largest x's and the smallest y's with the smallest x's. This means both that the covariance is large and a good regression line that comes very close to almost all the points is easily drawn. The correlation coefficient will also be very high (close to +1). An example will show why all these happen together.
Imagine that the equation for the regression line is  ,
,  , and
, and  , and the two points farthest to the top right, (10, 43) and (12, 51), lie exactly on the regression line. These two points
together contribute
, and the two points farthest to the top right, (10, 43) and (12, 51), lie exactly on the regression line. These two points
together contribute  to the numerator of the covariance. If we switched the x's and y's of these two points, moving them off the regression line, so
that they became (10, 51) and (12, 43),
to the numerator of the covariance. If we switched the x's and y's of these two points, moving them off the regression line, so
that they became (10, 51) and (12, 43),  ,
,  ,
,  , and
, and  would remain the same, but these points would only contribute (10-7)(51-31)+(12-7)(43-31)= 120 to the numerator. As you can see,
covariance is at its greatest, given the distributions of the x's and y's, when the (x, y) points lie on a straight line. Given that correlation, r, equals 1 when the covariance is maximized,
you can see that r=+1 when the points lie exactly on a straight line (with a positive slope). The closer the points lie to a straight line, the closer the covariance is to its maximum, and the
greater the correlation.
would remain the same, but these points would only contribute (10-7)(51-31)+(12-7)(43-31)= 120 to the numerator. As you can see,
covariance is at its greatest, given the distributions of the x's and y's, when the (x, y) points lie on a straight line. Given that correlation, r, equals 1 when the covariance is maximized,
you can see that r=+1 when the points lie exactly on a straight line (with a positive slope). The closer the points lie to a straight line, the closer the covariance is to its maximum, and the
greater the correlation.
As this example shows, the closer the points lie to a straight line, the higher the correlation. Regression finds the straight line that comes as close to the points as possible, so it should not be surprising that correlation and regression are related. One of the ways the "goodness of fit" of a regression line can be measured is by R2. For the simple two-variable case, R2 is simply the correlation coefficient, r, squared.
Correlation does not tell us anything about how steep or flat the regression line is, though it does tell us if the slope is positive or negative. If we took the initial population shown in
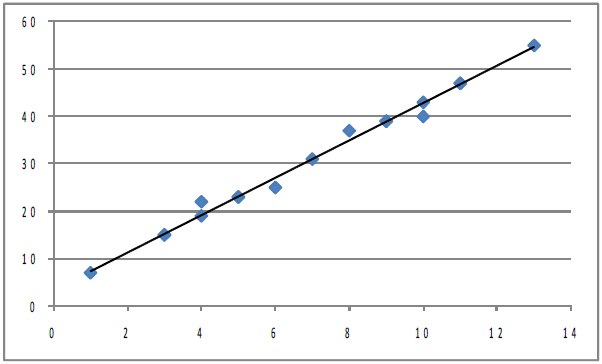
Figure 8.3 Plot of initial population, and stretched it both left and right horizontally so
that each point's x-value changed, but its y-value stayed the same,  would grow while
  stayed the same. If you pulled equally to the right and to the left, both
  and
and  would stay the same. The covariance would certainly grow since the
  that goes with each point would be larger absolutely while the
  's would stay the same. The equation of the regression line would change, with the
slope, b, becoming smaller, but the correlation coefficient would be the same because the points would be just as close to the regression line as before. Once again, notice that correlation
tells you how well the line fits the points, but it does not tell you anything about the slope other than if it is positive or negative. If the points are stretched out horizontally, the slope
changes but correlation does not. Also notice that though the covariance increases, correlation does not because σx increases causing the denominator in the equation for finding r to increase
as much as covariance, the numerator.
's would stay the same. The equation of the regression line would change, with the
slope, b, becoming smaller, but the correlation coefficient would be the same because the points would be just as close to the regression line as before. Once again, notice that correlation
tells you how well the line fits the points, but it does not tell you anything about the slope other than if it is positive or negative. If the points are stretched out horizontally, the slope
changes but correlation does not. Also notice that though the covariance increases, correlation does not because σx increases causing the denominator in the equation for finding r to increase
as much as covariance, the numerator.
The regression line and covariance approaches to understanding correlation are obviously related. If the points in the population lie very close to the regression line, the covariance will be large in absolute value since the x's that are far from their mean will be paired with y's which are far from theirs. A positive regression slope means that x and y rise and fall together, which also means that the covariance will be positive. A negative regression slope means that x and y move in opposite directions, which means a negative covariance.
- 2424 reads
