


In science and technology areas, particularly in occupational health and safety applications, risk assessments are usually done quantitatively, or by presenting quantitative results qualitatively.
Under quantitative approach to risk assessment, risk is defined as the probability of a hazard resulting in an adverse event, multiplied by the severity of the event (i.e. risk estimation). The quantitative measure of risks can then be used to judge whether or not a hazard is acceptable (i.e. risk evaluation). Under the IEC 1995 standard, this procedure is called probabilistic safety analysis or probabilistic risk analysis. Figure 1.1 will briefly explain the procedure of a safety analysis.
Procedure of a safety analysis
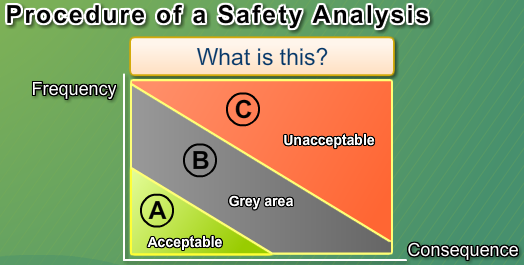
- shows the relationship between frequency of occurrence, the size of consequences or impacts, and limits of acceptance.
- is a procedure commonly used in risk evaluation.
|
Acceptable |
|
|
Grey area |
|
|
Unacceptable |
|
A risk estimation involves a number of analyses, including the following:
-
Frequency analysis
This estimates the probability of occurrence.
-
Consequence analysis
This estimates the level of consequence.
-
Risk calculations
This determines the quantitative measure of risks.
-
Uncertainty analysis
This determines the variation or imprecision in the model results.
-
Sensitivity analysis
This determines the changes in response of a model to changes in individual model parameters.
Instead of presenting the results as pure quantitative (i.e., numerical) estimates, qualitative descriptions are commonly used to represent these quantitative results. In practice, the results of quantitative studies are reported in narrative form punctuated by illustrative numerical examples like Table 1.1 and Table 1.2, which show examples of the classifications of consequences and probabilities under occupational safety applications.
| Code | Category |
|---|---|
| 0 | Not harmful or trivial |
| 1 | Short period of sick leave |
| 2 | Long period of sick leave |
| 3 | Disablement |
| 4 | Fatality |
| 5 | Several fatalities, major disaster |
Source: Harms-Ringdahl 2001, Table 4.1, p. 48
| Code | Category | Probability* |
|---|---|---|
| 0 | Very unlikely | 1 in a 1000 years |
| 1 | Unlikely | 1 in a 100 years |
| 2 | Rather unlikely | 1 in 10 years |
| 3 | Rather likely | Once a year |
| 4 | Likely | Once a month |
*Lower limit, i.e. less likely than the specified probability.
Source: Harms-Ringdahl 2001, Table 4.2, p. 48
Having highlighted some key points about quantitative assessment, you should now read the descriptions of the classification of risk assessment and quantitative assessments provided in Reading 1 (Part 1).
Reading 1
Harms-Ringdahl, L (2001) sections 4.1 and 4.2 of 'Risk assessment,' in Safety Analysis: Principles and Practice in Occupational Safety, CRC Press, pp. 43–49.
Now, please complete Activity 2 and answer the questions in Activity 3.
Do not forget to check the Activity 2 Feedback before moving on to the discussion on qualitative assessments.
- 2486 reads
