


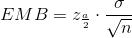
To construct a confidence interval for a single unknown population mean µ , where the population standard deviation is known, we need  as an estimate for µ and we need the margin of error. Here, the margin of error is
called the error bound for a population mean (abbreviated EBM). The sample mean
as an estimate for µ and we need the margin of error. Here, the margin of error is
called the error bound for a population mean (abbreviated EBM). The sample mean  is the point estimate of the unknown population mean µ
The confidence interval estimate will have the form:
(point estimate - error bound, point estimate + error bound) or, in symbols, 
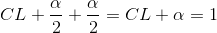
The margin of error depends on the confidence level (abbreviated CL). The confidence level is often considered the probability that the calculated confidence interval estimate will contain the true population parameter. However, it is more accurate to state that the confidence level is the percent of confidence intervals that contain the true population parameter when repeated samples are taken. Most often, it is the choice of the person constructing the confidence interval to choose a confidence level of 90% or higher because that person wants to be reasonably certain of his or her conclusions.
There is another probability called alpha (α). α is related to the confidence level CL. α is the probability that the interval does not contain the unknown population parameter. Mathematically, α + CL = 1.
Example 4.1
Suppose we have collected data from a sample. We know the sample mean but we do not know the mean for the entire population. The sample mean is 7 and the error bound for the mean is
2.5.

The confidence interval is (7 − 2.5, 7 + 2.5); calculating the values gives (4.5, 9.5).
If the confidence level (CL) is 95%, then we say that "We estimate with 95% confidence that the true value of the population mean is between 4.5 and 9.5." A confidence interval for a
population mean with a known standard deviation is based on the fact that the sample means follow an approximately normal distribution. Suppose that our sample has a mean of x = 10 and we
have constructed the 90% confidence interval (5, 15) where EBM = 5.
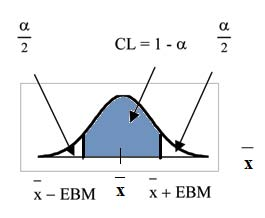
To get a 90% confidence interval, we must include the central 90% of the probability of the normal distribution. If we include the central 90%, we leave out a total of α = 10% in both tails,
or 5% in each tail, of the normal distribution.
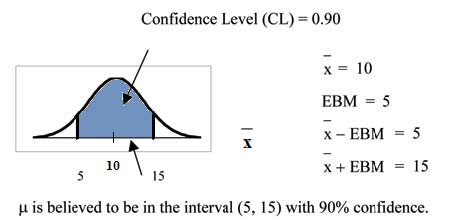
To capture the central 90%, we must go out 1.645 "standard deviations" on either side of the calculated sample mean. 1.645 is the z-score from a Standard Normal probability distribution that
puts an area of 0.90 in the center, an area of 0.05 in the far left tail, and an area of 0.05 in the far right tail.
It is important that the "standard deviation" used must be appropriate for the parameter we are estimating. So in this section, we need to use the standard deviation that applies to sample
means, which is  .
.  is commonly called the "standard error of the mean" in
order to clearly distinguish the standard deviation for a mean from the population standard deviation
is commonly called the "standard error of the mean" in
order to clearly distinguish the standard deviation for a mean from the population standard deviation  .
.
In summary, as a result of the Central Limit Theorem:
-
 is normally distributed, that is,
 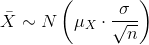 .
.
- When the population standard deviation σ is known, we use a Normal distribution to calculate the error bound.
Calculating the Confidence Interval:
To construct a confidence interval estimate for an unknown population mean, we need data from a random sample. The steps to construct and interpret the confidence interval are:
- Calculate the sample mean
 from the sample data.
Remember, in this section, we already know the population standard deviation σ.
from the sample data.
Remember, in this section, we already know the population standard deviation σ.
- Find the Z-score that corresponds to the confidence level.
- Calculate the error bound EBM
- Construct the confidence interval
- Write a sentence that interprets the estimate in the context of the situation in the problem. (Explain what the confidence interval means, in the words of the problem.)
We will first examine each step in more detail, and then illustrate the process with some examples.
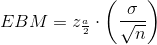
Finding z for the stated Confidence Level
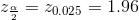
When we know the population standard deviation σ, we use a standard normal distribution to calculate the error bound EBM and construct the confidence interval. We need to find the value of z that puts an area equal to the confidence level (in decimal form) in the middle of the standard normal distribution Z∼N (0,1).
The confidence level, CL, is the area in the middle of the standard normal distribution. CL = 1 − α. So α is the area that is split equally between the two tails. Each of the tails contains an
area equal to  .
.
The z-score that has an area to the right of  is
denoted by
is
denoted by 
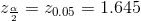
For example, when CL = 0.95 then α = 0.05 and  ; we write
The area to the right of z.025 is 0.025 and the area to the left of z.025 is 1-0.025 = 0.975
 , using a calculator, computer or a
Standard Normal probability table.
, using a calculator, computer or a
Standard Normal probability table.
Using the TI83, TI83+ or TI84+ calculator: invNorm(0.975, 0, 1) = 1.96
CALCULATOR NOTE: Remember to use area to the LEFT of 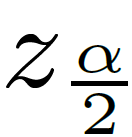 ; in this chapter the last two inputs 2 in the invNorm command are 0,1
because you are using a Standard Normal Distribution Z∼N(0,1)
; in this chapter the last two inputs 2 in the invNorm command are 0,1
because you are using a Standard Normal Distribution Z∼N(0,1)
EBM: Error Bound
The error bound formula for an unknown population mean µ when the population standard deviation σ is known is
Constructing the Confidence Interval
- The confidence interval estimate has the format

The graph gives a picture of the entire situation.
Writing the Interpretation
The interpretation should clearly state the confidence level (CL), explain what population parameter is being estimated (here, a population mean), and should state the confidence interval (both endpoints). "We estimate with _______ % confidence that the true population mean (include context of the problem) is between _______ and (include appropriate units)."
Example 4.2
Suppose scores on exams in statistics are normally distributed with an unknown population mean and a population standard deviation of 3 points. A random sample of 36 scores is taken and gives a sample mean (sample mean score) of 68. Find a confidence interval estimate for the population mean exam score (the mean score on all exams).
Problem
Find a 90% confidence interval for the true (population) mean of statistics exam scores.
Solution
- You can use technology to directly calculate the confidence interval
- The first solution is shown step-by-step (Solution A).
- The second solution uses the TI-83, 83+ and 84+ calculators (Solution B).
Solution A
To find the confidence interval, you need the sample mean,  , and
the EBM.
, and
the EBM.

σ =3 ; n = 36 ; The confidence level is 90% (CL = 0.90)
CL = 0.90 so α = 1 − CL = 1 − 0.90 = 0.10


The area to the right of z.05 is 0.05 and the area to the left of z.05 is 1−0.05 =0.95
using invNorm(0.95,0,1) on the TI-83,83+,84+ calculators. This can also be found using appropriate commands on other calculators, using a computer, or using a probability table for the
Standard Normal distribution.
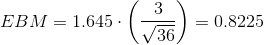


The 90% confidence interval is (67.1775, 68.8225).
Solution B
Using a function of the TI-83, TI-83+ or TI-84 calculators:
Press STAT and arrow over to TESTS.
Arrow down to 7:ZInterval.
Press ENTER.
Arrow to Stats and press ENTER.
Arrow down and enter 3 for σ, 68 for  , 36 for n, and .90 for
C-level.
, 36 for n, and .90 for
C-level.
Arrow down to Calculate and press ENTER.
The confidence interval is (to 3 decimal places) (67.178, 68.822).
Interpretation
We estimate with 90% confidence that the true population mean exam score for all statistics students is between 67.18 and 68.82.
Explanation of 90% Confidence Level
90% of all confidence intervals constructed in this way contain the true mean statistics exam score. For example, if we constructed 100 of these confidence intervals, we would expect 90 of them to contain the true population mean exam score.
- 6106 reads
