


The requirements need to be documented unambiguously, to minimize later differences in interpretation. There is no standard format: text, schematics, and even prototypes can be used.
The most useful guideline is to document the requirements in plain language as testable statements. For functional requirements, this is pretty straightforward, for example: “After the customer has tried unsuccessfully to enter a Personal Identification Number (PIN) three times, the system will terminate the transaction, send an alert to the Security Department and retain the customer’s card.” This statement can now be cross-referenced to the design (in what module is this function implemented?) and to the test data (where are the instructions to the tester to try three wrong PINs and how is the result of this test documented?).
Plain language is useful for rigor and completeness; however, for any but the smallest systems, plain text becomes cumbersome and confusing. It is hard to communicate to users what the system will do and how it will accomplish its overall objective, and asking them to take a position on whether everything is covered is unfair. In particular, you are likely to hear, later on, comments of the type, “I assumed that this or that function was covered...” or, “It goes without saying that...” If these comments come as responses to processing errors once the system has been implemented, it is too late.
To address this problem, information systems professionals have developed a range of graphical representation tools, the three most widely used of which are decomposition diagrams (also known as Warnier charts after their advocate, a French analyst named Jean-Dominique Warnier), data flow diagrams (DFDs), and entity-relationship diagrams (ERDs).
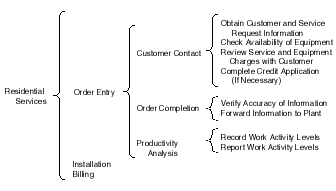
Warnier charts, an example of which is shown in Figure 3.5, show how a function can be decomposed into subfunctions. In turn, each subfunction can be further subdivided, all the way down to an elementary level. (The same hierarchical decomposition technique can be used in many other contexts, for example in outlining an essay.) The technique has the advantage of being easy to grasp and easy to use. However, it is not suitable for all purposes. It essentially can depict only a static structure, which must, in addition, be composed of mutually exclusive and completely exhaustive elements – MECE in analyst jargon. In other words, the decomposition must not leave anything out and no element can be used in more than one place.
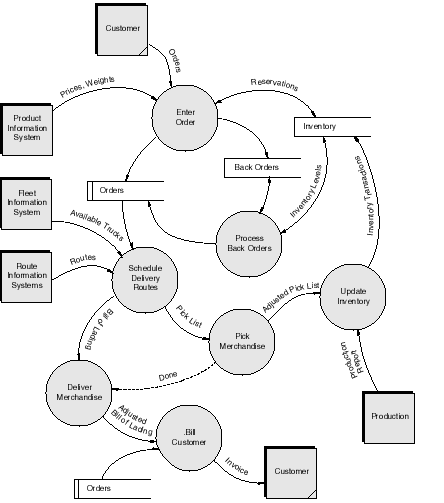
DFDs depict a flow of activities whereas the Warnier chart technique depicts static structures. An example is shown in Figure 3.6. Data flow diagrams are more powerful than Warnier diagrams but are a little more difficult to grasp and to draw correctly. They are best adapted to repetitive administrative work: processing a pile of customer orders that have come in through the mail, picking the orders from inventory, delivering them, mailing invoices and collecting payments. 1 (This was how most information systems were organized before the days of computers and in the early period of information technology; it is still used by utilities such as phone and electric companies for billing and payments; it goes under the name of batch processing.) As a result, DFDs are no longer as widely used as before. A variation that remains in widespread use is a diagram that shows the flow of activity down the page which is divided in columns, one for each organizational entity or system that intervenes in the processing of a single function. (This type of chart has been called “swimlane diagrams.”)
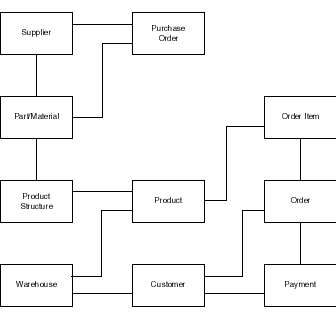
ERDs have a different purpose from Warnier charts and DFDs. They depict data structures: entities that correspond to things about which the system maintains data, such as customers, products, and orders; and relationships between them, such as the fact that each order belongs to one customer, but each customer may place several orders, and that each order consists of several products. In addition to identifying the entities and relationships, the model identifies the main attributes, or pieces of data, to be stored for each entity. An example is shown in . The ERD is an invaluable tool not only to point out dependencies and relationships among pieces of data, but also for the actual design of relational databases. 2
Other techniques are available for more specialized purposes, and you can also, if you have a specific need, develop your own. Bear in mind that you may then have to invest in training other people to use your homegrown technique.
Graphical techniques are indispensable tools for communicating and explaining requirements. But that is all they are. If a given technique falls short of this objective, don’t use it. Above all, do not get caught up in the formalism and the stringent rules that some authors prescribe if these rules interfere with the main purpose. (But do remember that you are communicating not only with users and management, but also with your colleagues, who may have very specific expectations about the techniques you have selected.)
- 4175 reads
