


Available under Creative Commons-ShareAlike 4.0 International License.
Graphs without labels are incomplete and labeling elements such as plot title, labels for x and y axes, and legend should be included. Using up arrow, recall the statement above and add the annotation commands as shown below.
x=[-pi:.1:pi];y=sin(x);plot(x,y);title('Graph of y=sin(x)');xlabel('x');ylabel('sin(x)');grid on
Run the file and compare your result with the first one.
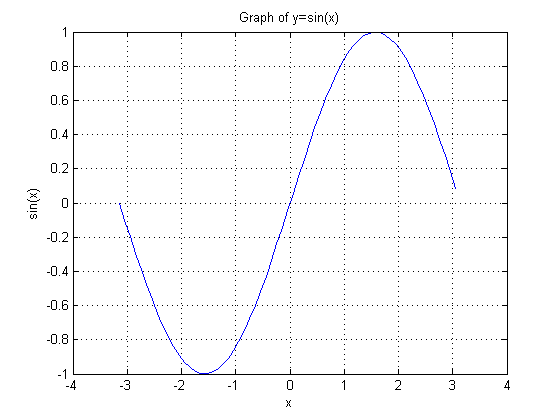
Figure 3.3 Graph of sin(x) with Labels.
ASIDE: Type in the following at the MATLAB prompt and learn additional commands to annotate plots:
help gtext
help legend
help zlabel
- 1839 reads
