


Available under Creative Commons-ShareAlike 4.0 International License.
Data can be entered as follows:
temperature = [100, 150, 200, 250, 300, 400, 500];
energy = [2506.7, 2582.8, 2658.1, 2733.7, 2810.4, 2967.9, 3131.6];
we can now plot the data by typing in
plot(temperature,energy);title('temperature vs. energy');xlabel('temperature');ylabel('energy');
at the MATLAB prompt. The following plot is generated, select Tools > Basic Fitting:
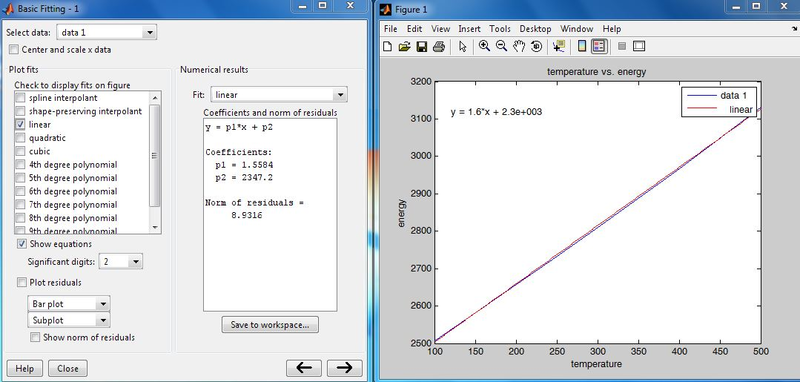
As shown above, the relationship between temperature and internal energy is:
or

- 2157 reads
