


Take, for example, a startup company with USD 1,000 sales during the first year. If sales double (100 percent growth rate) every year, the sales curve over the first twelve years will be:
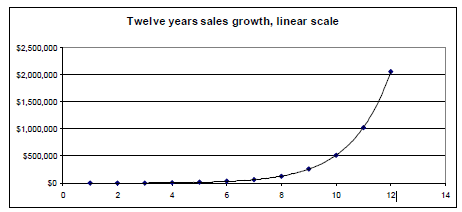
Sales are growing exponentially, but the curve is almost flat at the beginning and then shoots nearly straight up. Graphing the same data using a logarithmic scale on the Y axis gives us a better picture of the constant growth rate:
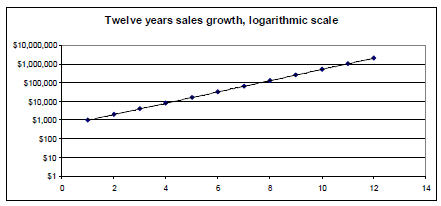
Note that since the growth rate is constant (100 percent per year in this example), the graph is a straight line. You can experiment with differing growth rates using the attached spreadsheet.
Of course, nothing, not even technology, improves exponentially for ever. At some point, exponential improvement hits limits, and slows down. Consider the following graph of world records in the 100 meter dash: 1
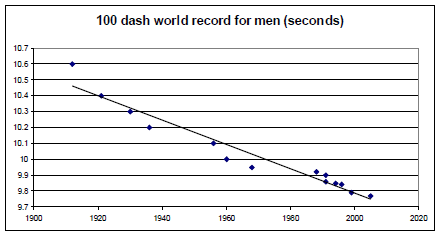
There is steady improvement, but it is at a roughly linear rate. The record improves by a constant amount, not at a constant rate.
- 3513 reads
