


You’ve determined that you have a project. What now? The notes you scribbled down on the back of the napkin at lunch are a start, but not exactly good project management practice. Too often, organizations follow Nike’s advice when it comes to managing projects when they “just do it.” An assignment is made, and the project team members jump directly into the development of the product or service requested. In the end, the delivered product doesn’t meet the expectations of the customer. Unfortunately, many projects follow this poorly constructed path, and that is a primary contributor to a large percentage of projects not meeting their original objectives, as defined by performance, schedule, and budget.
In the United States, more than $250 billion is spent each year on information technology (IT) application development in approximately 175,000 projects. The Standish Group (a Boston-based leader in project and value performance research) released the summary version of their 2009 CHAOS Report that tracks project failure rates across a broad range of companies and industries (Figure 2.1 Summary of 2009 Standish Group CHAOS report. Chaosreport2009 by Merrie Barron & Andrew R. Barron).
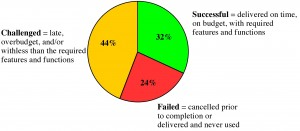
Jim Johnson, chairman of the Standish Group, has stated that “this year’s results show a marked decrease in project success rates, with 32% of all projects succeeding which are delivered on time, on budget, with required features and functions, 44% were challenged-which are late, over budget, and/or with less than the required features and functions and 24% failed which are cancelled prior to completion or delivered and never used.”
When are companies going to stop wasting billions of dollars on failed projects? The vast majority of this waste is completely avoidable: simply get the right business needs (requirements) understood early in the process and ensure that project management techniques are applied and followed, and the project activities are monitored.
Applying good project management discipline is the way to help reduce the risks. Having good project management skills does not completely eliminate problems, risks, or surprises. The value of good project management is that you have standard processes in place to deal with all contingencies.
Project management is the application of knowledge, skills, tools, and techniques applied to project activities in order to meet the project requirements. Project management is a process that includes planning, putting the project plan into action, and measuring progress and performance.
Managing a project includes identifying your project’s requirements and writing down what everyone needs from the project. What are the objectives for your project? When everyone understands the goal, it’s much easier to keep them all on the right path. Make sure you set goals that everyone agrees on to avoid team conflicts later on. Understanding and addressing the needs of everyone affected by the project means the end result of your project is far more likely to satisfy your stakeholders. Last but not least, as project manager, you will also be balancing the many competing project constraints.
On any project, you will have a number of project constraints that are competing for your attention. They are cost, scope, quality, risk, resources, and time.
- Cost is the budget approved for the project including all necessary expenses needed to deliver the project. Within organizations, project managers have to balance between not running out of money and not under spending because many projects receive funds or grants that have contract clauses with a “use it or lose it” approach to project funds. Poorly executed budget plans can result in a last-minute rush to spend the allocated funds. For virtually all projects, cost is ultimately a limiting constraint; few projects can go over budget without eventually requiring a corrective action.
- Scope is what the project is trying to achieve. It entails all the work involved in delivering the project outcomes and the processes used to produce them. It is the reason and the purpose of the project.
- Quality is a combination of the standards and criteria to which the project’s products must be delivered for them to perform effectively. The product must perform to provide the functionality expected, solve the identified problem, and deliver the benefit and value expected. It must also meet other performance requirements, or service levels, such as availability, reliability, and maintainability, and have acceptable finish and polish. Quality on a project is controlled through quality assurance (QA), which is the process of evaluating overall project performance on a regular basis to provide confidence that the project will satisfy the relevant quality standards.
- Risk is defined by potential external events that will have a negative impact on your project if they occur. Risk refers to the combination of the probability the event will occur and the impact on the project if the event occurs. If the combination of the probability of the occurrence and the impact on the project is too high, you should identify the potential event as a risk and put a proactive plan in place to manage the risk.
- Resources are required to carry out the project tasks. They can be people, equipment, facilities, funding, or anything else capable of definition (usually other than labor) required for the completion of a project activity.
- Time is defined as the time to complete the project. Time is often the most frequent project oversight in developing projects. This is reflected in missed deadlines and incomplete deliverables. Proper control of the schedule requires the careful identification of tasks to be performed and accurate estimations of their durations, the sequence in which they are going to be done, and how people and other resources are to be allocated. Any schedule should take into account vacations and holidays.
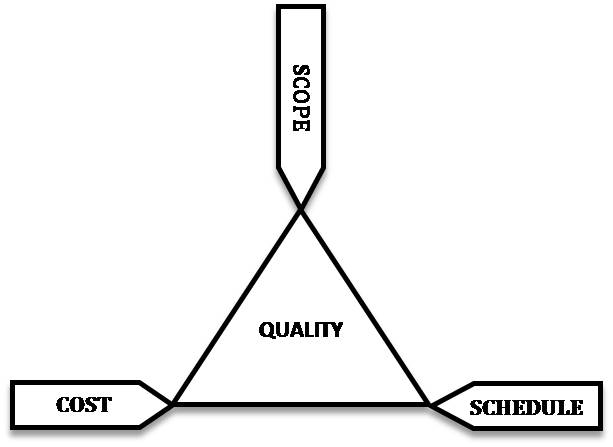
You may have heard of the term “triple constraint,” which traditionally consisted of only time, cost, and scope. These are the primary competing project constraints that you have to be most aware of. The triple constraint is illustrated in the form of a triangle to visualize the project work and see the relationship between the scope/quality, schedule/time, and cost/resource (Figure 2.2 A schematic of the triple constraint triangle. The triad constraints by John M. Kennedy T. ).
Your project may have additional constraints that you must face, and as the project manager, you have to balance the needs of these constraints against the needs of the stakeholders and your project goals. For instance, if your sponsor wants to add functionality to the original scope, you will very likely need more money to finish the project, or if they cut the budget, you will have to reduce the quality of your scope, and if you don’t get the appropriate resources to work on your project tasks, you will have to extend your schedule because the resources you have take much longer to finish the work.
You get the idea; the constraints are all dependent on each other. Think of all of these constraints as the classic carnival game of Whac-a-mole (Figure 2.3 Whac-a-mole. ). Each time you try to push one mole back in the hole, another one pops out. The best advice is to rely on your project team to keep these moles in place.
Here is an example of a project that cut quality because the project costs were fixed. The P-36 oil platform (Figure 2.4 The Petrobras P-36 oil platform. P36 No 010 by Richard Collinson ) was the largest footing production platform in the world capable of processing 180,000 barrels of oil per day and 5.2 million cubic meters of gas per day. Located in the Roncador Field, Campos Basin, Brazil, the P-36 was operated by Petrobras.
In March 2001, the P-36 was producing around 84,000 barrels of oil and 1.3 million cubic meters of gas per day when it became destabilized by two explosions and subsequently sank in 3,900 feet of water with 1,650 short tons of crude oil remaining on board, killing 11 people. The sinking is attributed to a complete failure in quality assurance, and pressure for increased production led to corners being cut on safety procedures. It is listed as one of the most expensive accidents with a price tag of $515,000,000.

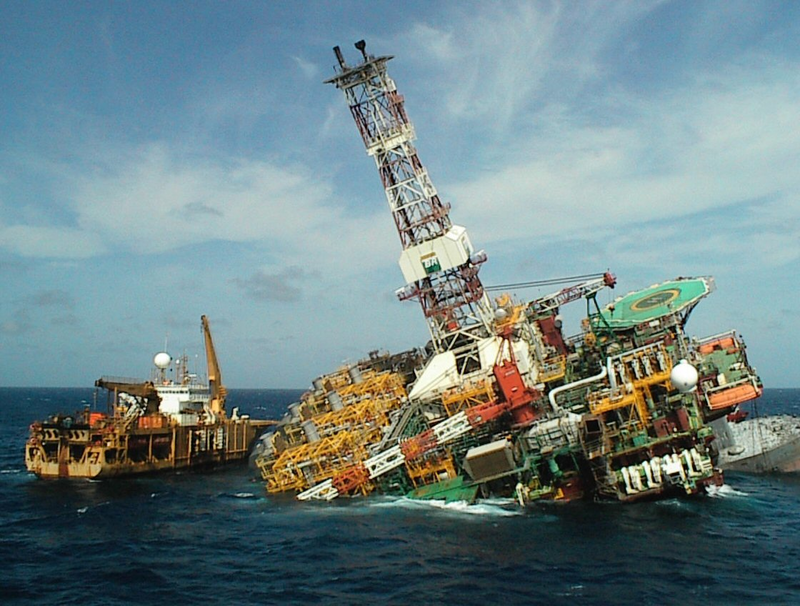
The following quotes are from a Petrobras executive, citing the benefits of cutting quality assurance and inspection costs on the project, while the accompanying pictures are the result of this proud achievement in project management by Petrobras. The quotation is provided one sentence at a time and compared with pictures of the actual outcome.
“Petrobras has established new global benchmarks for the generation of exceptional shareholder wealth through an aggressive and innovative program of cost cutting on its P36 production facility.” “Conventional constraints have been successfully challenged and replaced with new paradigms appro priate to the globalized corporate market place.”
“Elimination of these unnecessary straitjackets has empowered the project’s suppliers and contractors to propose highly economical solutions, with the win-win bonus of enhanced profitability margins for themselves.”
“The P36 platform shows the shape of things to come in the unregulated global market economy of the 21st century.”
The dynamic trade-offs between the project constraint values have been humorously and accurately described in Figure 2.5 A sign seen at an automotive repair shop. .
- 4005 reads
