


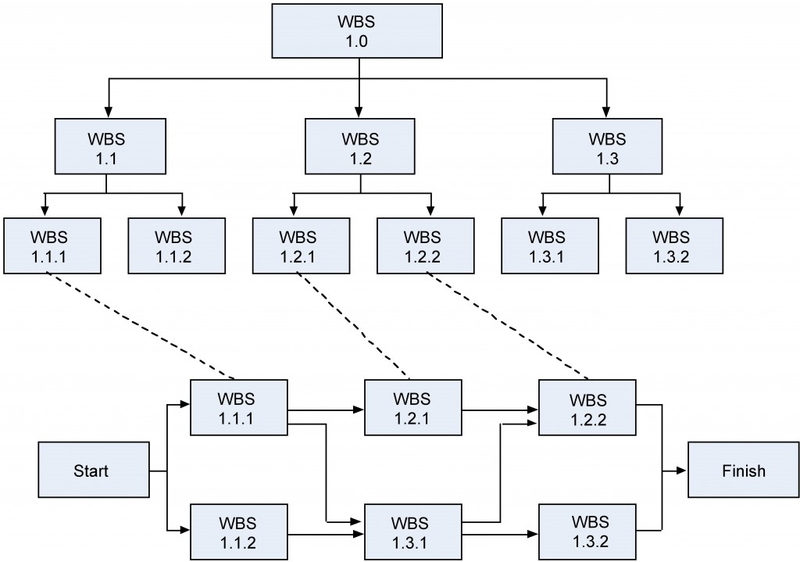
Many project managers use network diagrams when scheduling a project. The network diagram is a way to visualize the interrelationships of project activities. Network diagrams provide a graphical view of the tasks and how they relate to one another. The tasks in the network are the work packages of the WBS. All of the WBS tasks must be included in the network because they have to be accounted for in the schedule. Leaving even one task out of the network could change the overall schedule duration, estimated costs, and resource allocation commitments.
The first step is to arrange the tasks from your WBS into a sequence. Some tasks can be accomplished at any time throughout the project where other tasks depend on input from another task or are constrained by time or resources.
The WBS is not a schedule, but it is the basis for it. The network diagram is a schedule but is used primarily to identify key scheduling information that ultimately goes into user-friendly schedule formats, such as milestone and Gantt charts.
The network diagram provides important information to the project team. It provides information about how the tasks are related (Figure 10.9 The relationship between the work breakdown structure (WBS) and the network diagram. ), where the risk points are in the schedule, how long it will take as currently planned to finish the project, and when each task needs to begin and end.
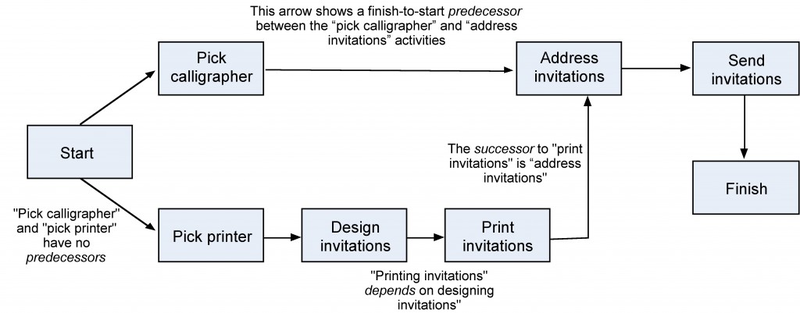
In our wedding planner example, Sally would look for relationships between tasks and determine what can be done in parallel and what activities need to wait for others to complete. As an example, Figure 10.10 An example of an activity on node (AON) diagram. shows how the activities involved in producing the invitations depend on one another. Showing the activities in rectangles and their relationships as arrows is called a precedence diagramming method (PDM). This kind of diagram is also called an activity-on-node (AON) diagram.
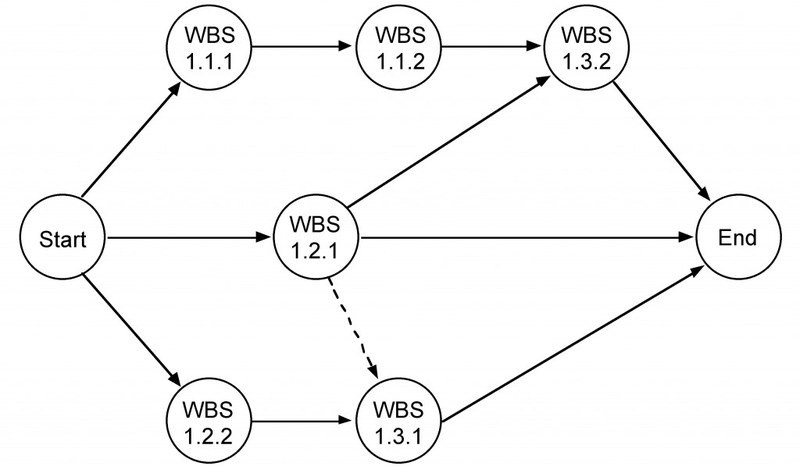
Another way to show how tasks relate is with the activity-on-arrow (AOA) diagram. Although AON is more commonly used and is supported by all project management programs, PERT is the best-known AOA-type diagram and is the historical basis of all network diagramming. The main difference is the AOA diagram is traditionally drawn using circles as the nodes, with nodes representing the beginning and ending points of the arrows or tasks. In the AOA network, the arrows represent the activities or tasks (Figure 10.11 An example of an activity arrow (AOA) network diagram. ).
All network diagrams have the advantages of showing task interdependencies, start and end times, and the critical path (the longest path through the network) but the AOA network diagram has some disadvantages that limit the use of the method.
The three major disadvantages of the AOA method are:
- The AOA network can only show finish-to-start relationships. It is not possible to show lead and lag except by adding or subtracting time, which makes project tracking difficult.
- There are instances when dummy activities can occur in an AOA network. Dummy activities are activities that show the dependency of one task on other tasks but for other than technical reasons. For example, one task may depend on another because it would be more cost effective to use the same resources for the two; otherwise the two tasks could be accomplished in parallel. Dummy activities do not have durations associated with them. They simply show that a task has some kind of dependence on another task.
- AOA diagrams are not as widely used as AON diagrams simply because the latter are somewhat simpler to use, and all project management software programs can accommodate AON networks, whereas not all can accommodate AOA networks.
- 17174 reads
