


A Gantt chart is a type of bar chart, developed by Henry Gantt, that illustrates a project schedule. Gantt charts are easy to read and are commonly used to display schedule activities. These charts display the start and finish dates of the terminal elements and summary elements of a project. Terminal elements and summary elements comprise the work breakdown structure of the project. Some Gantt charts also show the dependency relationships (i.e., precedence network) between activities.
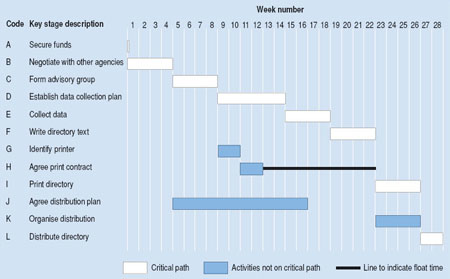
Gantt charts show all the key stages of a project and their duration as a bar chart, with the time scale across the top. The key stages are placed on the bar chart in sequence, starting in the top left corner and ending in the bottom right corner (Figure 10.8 Gantt chart for directory production ). A Gantt chart can be drawn quickly and easily and is often the first tool a project manager uses to provide a rough estimate of the time that it will take to complete the key tasks. Sometimes it is useful to start with the target deadline for completion of the whole project, because it is soon apparent if the time scale is too short or unnecessarily long. The detailed Gantt chart is usually constructed after the main objectives have been determined.
In this example inFigure 10.8 Gantt chart for directory production , key stage K (Organize distribution) starts at week 23 so that its end point coincides with key stage L (Distribute directory). However, K could begin as early as week 17, as soon as key stage J is completed. Key stage K is therefore said to have “slack.” Key stage H (Agree print contract) has been placed to end at week 12. However, it could end as late as week 22, because key stage I (Print directory) does not begin until week 23. Key stage H is therefore said to have “float.” Float time can be indicated on the chart by adding a line ahead of the bar to the latest possible end point. Slack and float show you where there is flexibility in the schedule, and this can be useful when you need to gain time once the project is up and running.
You can add other information to a Gantt chart, for example:
- Milestones could be indicated by using a symbol such as a diamond or triangle.
- Project meetings could be indicated by another symbol such as a circle.
- Reviews of progress could be indicated by a square.
For a complex project, you may decide to produce a separate Gantt chart for each of the key stages. If you do this shortly before each key stage begins, you will be able to take any last-minute eventualities into account. These charts provide a useful tool for monitoring and control as the project progresses.
Gantt charts are relatively easy to draw by hand, but this doesn’t offer the same level of flexibility during monitoring that you would get from a software package. Various programs are available to assist project managers in scheduling and control. Once the data have been entered, a program helps you to work on “what if” scenarios, showing what might happen if a key stage is delayed or speeded up. This is more difficult if you are working manually.
- 5503 reads
