


In addition to its focus on individual participants, single-subject research differs from group research in the way the data are typically analyzed. As we have seen throughout the book, group research involves combining data across participants. Group data are described using statistics such as means, standard deviations, Pearson’s r, and so on to detect general patterns. Finally, inferential statistics are used to help decide whether the result for the sample is likely to generalize to the population. Single-subject research, by contrast, relies heavily on a very different approach called visual inspection. This means plotting individual participants’ data as shown throughout this chapter, looking carefully at those data, and making judgments about whether and to what extent the independent variable had an effect on the dependent variable. Inferential statistics are typically not used.
In visually inspecting their data, single-subject researchers take several factors into account. One of them is changes in the level of the dependent variable from condition to condition. If the dependent variable is much higher or much lower in one condition than another, this suggests that the treatment had an effect. A second factor is trend, which refers to gradual increases or decreases in the dependent variable across observations. If the dependent variable begins increasing or decreasing with a change in conditions, then again this suggests that the treatment had an effect. It can be especially telling when a trend changes directions—for example, when an unwanted behavior is increasing during baseline but then begins to decrease with the introduction of the treatment. A third factor is latency, which is the time it takes for the dependent variable to begin changing after a change in conditions. In general, if a change in the dependent variable begins shortly after a change in conditions, this suggests that the treatment was responsible.
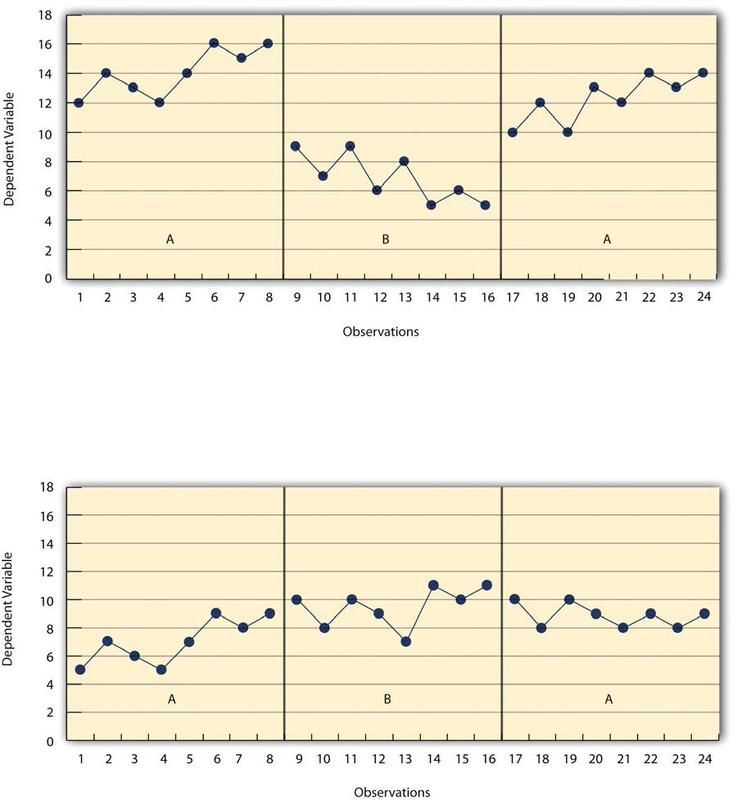
In the top panel of Figure 10.5, there are fairly obvious changes in the level and trend of the dependent variable from condition to condition. Furthermore, the latencies of these changes are short; the change happens immediately. This pattern of results strongly suggests that the treatment was responsible for the changes in the dependent variable. In the bottom panel of Figure 10.5, however, the changes in level are fairly small. And although there appears to be an increasing trend in the treatment condition, it looks as though it might be a continuation of a trend that had already begun during baseline. This pattern of results strongly suggests that the treatment was not responsible for any changes in the dependent variable—at least not to the extent that single-subject researchers typically hope to see.
The results of single-subject research can also be analyzed using statistical procedures—and this is becoming more common. There are many different approaches, and single-subject researchers continue to debate which are the most useful. One approach parallels what is typically done in group research. The mean and standard deviation of each participant’s responses under each condition are computed and compared, and inferential statistical tests such as the ttest or analysis of variance are applied (Fisch, 2001). 1 (Note that averaging acrossparticipants is less common.) Another approach is to compute the percentage of nonoverlapping data (PND) for each participant (Scruggs & Mastropieri, 2001). 2 This is the percentage of responses in the treatment condition that are more extreme than the most extreme response in a relevant control condition. In the study of Hall and his colleagues, for example, all measures of Robbie’s study time in the first treatment condition were greater than the highest measure in the first baseline, for a PND of 100%. The greater the percentage of nonoverlapping data, the stronger the treatment effect. Still, formal statistical approaches to data analysis in single-subject research are generally considered a supplement to visual inspection, not a replacement for it.
KEY TAKEAWAYS
- Single-subject research designs typically involve measuring the dependent variable repeatedly over time and changing conditions (e.g., from baseline to treatment) when the dependent variable has reached a steady state. This approach allows the researcher to see whether changes in the independent variable are causing changes in the dependent variable.
- In a reversal design, the participant is tested in a baseline condition, then tested in a treatment condition, and then returned to baseline. If the dependent variable changes with the introduction of the treatment and then changes back with the return to baseline, this provides strong evidence of a treatment effect.
- In a multiple-baseline design, baselines are established for different participants, different dependent variables, or different settings—and the treatment is introduced at a different time on each baseline. If the introduction of the treatment is followed by a change in the dependent variable on each baseline, this provides strong evidence of a treatment effect.
- Single-subject researchers typically analyze their data by graphing them and making judgments about whether the independent variable is affecting the dependent variable based on level, trend, and latency.
EXERCISES
- Practice: Design a simple single-subject study (using either a reversal or multiple-baseline design) to answer the following questions. Be sure to specify the treatment,
operationally define the dependent variable, decide when and where the observations will be made, and so on.
- Does positive attention from a parent increase a child’s toothbrushing behavior?
- Does self-testing while studying improve a student’s performance on weekly spelling tests?
- Does regular exercise help relieve depression?Practice: Create a graph that displays the hypothetical results for the study you designed in Exercise
- Write a paragraph in which you describe what the results show. Be sure to comment on level, trend, and latency.
- 6079 reads
