


In null hypothesis testing, the researcher tries to draw a reasonable conclusion about the population based on the sample. Unfortunately, this conclusion is not guaranteed to be correct. This is illustrated by Figure 13.3. The rows of this table represent the two possible decisions that we can make in null hypothesis testing: to reject or retain the null hypothesis. The columns represent the two possible states of the world: The null hypothesis is false or it is true. The four cells of the table, then, represent the four distinct outcomes of a null hypothesis test. Two of the outcomes—rejecting the null hypothesis when it is false and retaining it when it is true—are correct decisions. The other two—rejecting the null hypothesis when it is true and retaining it when it is false—are errors.
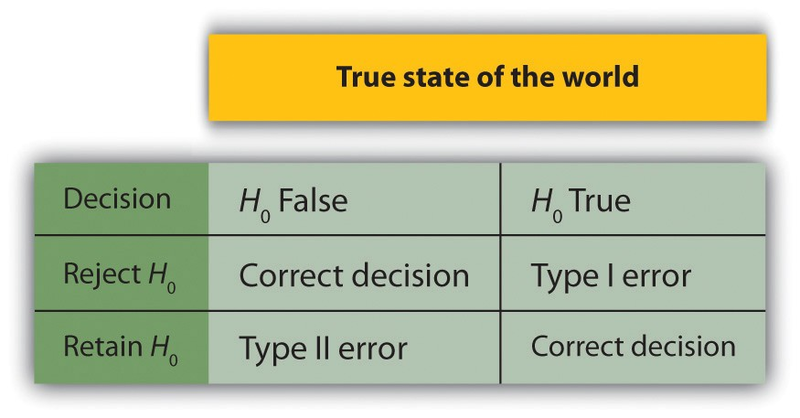
Rejecting the null hypothesis when it is true is called a Type I error. This means that we have concluded that there is a relationship in the population when in fact there is not. Type I errors occur because even when there is no relationship in the population, sampling error alone will occasionally produce an extreme result. In fact, when the null hypothesis is true and α is .05, we will mistakenly reject the null hypothesis 5% of the time. (This is why α is sometimes referred to as the “Type I error rate.”) Retaining the null hypothesis when it is false is called a Type II error. This means that we have concluded that there is no relationship in the population when in fact there is. In practice, Type II errors occur primarily because the research design lacks adequate statistical power to detect the relationship (e.g., the sample is too small). We will have more to say about statistical power shortly.
In principle, it is possible to reduce the chance of a Type I error by setting α to something less than .05. Setting it to .01, for example, would mean that if the null hypothesis is true, then there is only a 1% chance of mistakenly rejecting it. But making it harder to reject true null hypotheses also makes it harder to reject false ones and therefore increases the chance of a Type II error. Similarly, it is possible to reduce the chance of a Type II error by setting α to something greater than .05 (e.g., .10). But making it easier to reject false null hypotheses also makes it easier to reject true ones and therefore increases the chance of a Type I error. This provides some insight into why the convention is to set α to .05. There is some agreement among researchers that level of α keeps the rates of both Type I and Type II errors at acceptable levels.
The possibility of committing Type I and Type II errors has several important implications for interpreting the results of our own and others’ research. One is that we should be cautious about interpreting the results of any individual study because there is a chance that it reflects a Type I or Type II error. This is why researchers consider it important to replicate their studies. Each time researchers replicate a study and find a similar result, they rightly become more confident that the result represents a real phenomenon and not just a Type I or Type II error.
Another issue related to Type I errors is the so-called file drawer problem (Rosenthal, 1979). 1 The idea is that when researchers obtain statistically significant results, they tend to submit them for publication, and journal editors and reviewers tend to accept them. But when researchers obtain nonsignificant results, they tend not to submit them for publication, or if they do submit them, journal editors and reviewers tend not to accept them. Researchers end up putting these nonsignificant results away in a file drawer (or nowadays, in a folder on their hard drive). One effect of this is that the published literature probably contains a higher proportion of Type I errors than we might expect on the basis of statistical considerations alone. Even when there is a relationship between two variables in the population, the published research literature is likely to overstate the strength of that relationship. Imagine, for example, that the relationship between two variables in the population is positive but weak (e.g., ρ = +.10). If several researchers conduct studies on this relationship, sampling error is likely to produce results ranging from weak negative relationships (e.g., r= −.10) to moderately strong positive ones (e.g., r= +.40). But because of the file drawer problem, it is likely that only those studies producing moderate to strong positive relationships are published. The result is that the effect reported in the published literature tends to be stronger than it really is in the population.
The file drawer problem is a difficult one because it is a product of the way scientific research has traditionally been conducted and published. One solution might be for journal editors and reviewers to evaluate research submitted for publication without knowing the results of that research. The idea is that if the research question is judged to be interesting and the method judged to be sound, then a nonsignificant result should be just as important and worthy of publication as a significant one. Short of such a radical change in how research is evaluated for publication, researchers can still take pains to keep their nonsignificant results and share them as widely as possible (e.g., at professional conferences). Many scientific disciplines now have journals devoted to publishing nonsignificant results. In psychology, for example, there is the Journal of Articles in Support of the Null Hypothesis (http://www.jasnh.com).
- 2102 reads
