


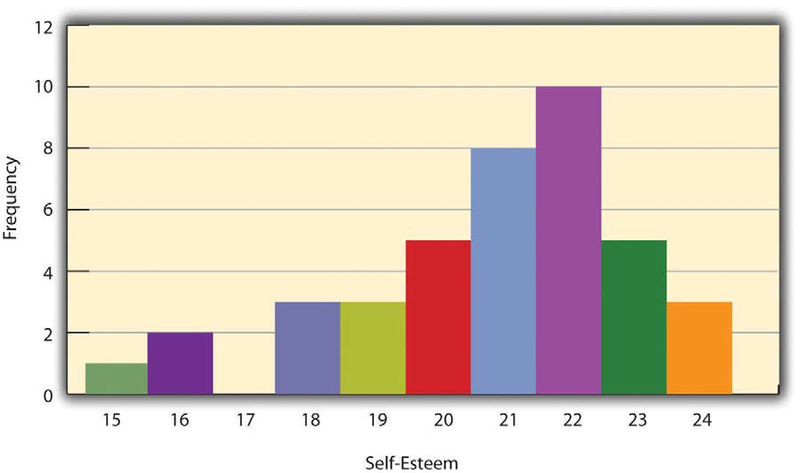
A histogram is a graphical display of a distribution. It presents the same information as a frequency table but in a way that is even quicker and easier to grasp. The histogram in Figure 12.1 presents the distribution of self-esteem scores in Table 12.1. The x-axis of the histogram represents the variable and the y-axis represents frequency. Above each level of the variable on the x-axis is a vertical bar that represents the number of individuals with that score. When the variable is quantitative, as in this example, there is usually no gap between the bars. When the variable is categorical, however, there is usually a small gap between them. (The gap at 17 in this histogram reflects the fact that there were no scores of 17 in this data set.)
- 2058 reads
