


Now the health psychologist wants to compare the calorie estimates of people who regularly eat junk food with the estimates of people who rarely eat junk food. He believes the difference could come out in either direction so he decides to conduct a two-tailed test. He collects data from a sample of eight participants who eat junk food regularly and seven participants who rarely eat junk food. The data are as follows:
Junk food eaters: 180, 220, 150, 85, 200, 170, 150, 190
Non–junk food eaters: 200, 240, 190, 175, 200, 300, 240
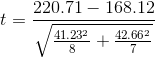
The mean for the junk food eaters is 220.71 with a standard deviation of 41.23. The mean for the non– junk food eaters is 168.12 with a standard deviation of 42.66. He can now compute his tscore as follows:
If he enters the data into one of the online analysis tools or uses Excel or SPSS, it would tell him that the two-tailed p value for this t score (with 15 − 2 = 13 degrees of freedom) is .015. Because this is less than .05, the health psychologist would reject the null hypothesis and conclude that people who eat junk food regularly make lower calorie estimates than people who eat it rarely. If he were to compute the tscore by hand, he could look at Table 13.2 and see that the critical value of tfor a two- tailed test with 13 degrees of freedom is ±2.160. The fact that his t score was more extreme than this critical value would tell him that his pvalue is less than .05 and that he should fail to retain the null hypothesis.
- 3109 reads
