


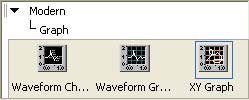
Using the previous G program example, we will now visualize the results by adding a graph to the Front Panel windows. Right click on the Front Panel window. Select XY Graph from the Controls » Modern » Graph menu.
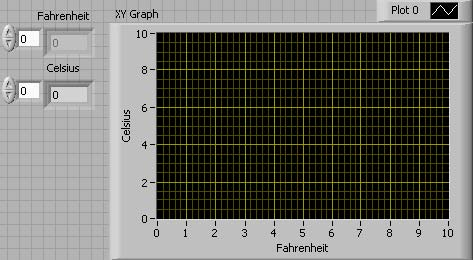
Drop the XY Graph in the Front Panel window. Double click on the x and y axis labels and renameTime to Fahrenheit and Amplitude to Celsius.
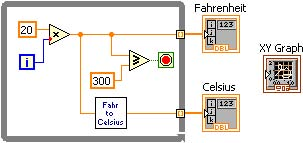
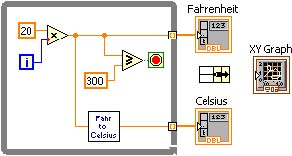
The Block Diagram window contains theXY Graph terminal.
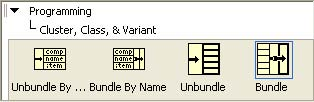
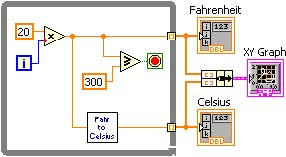
Select Bundle from the Functions » Programming » Cluster, Class & Variant menu
Drop it on the diagram as shown in Bundle for XY Graph.
Wire the Fahrenheit and Celsius results to the input Bundle terminals and the output Bundle terminal to the XY Graph.
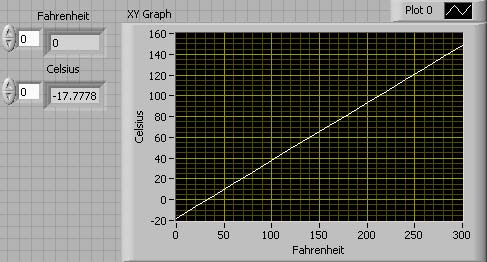
Save the program and run it. The resulting graph is shown in the fgure below.
- 2259 reads
