


This G program shows how G allows programmers to develop interactive programs. Create the following G program and wire it as shown in the figure below.
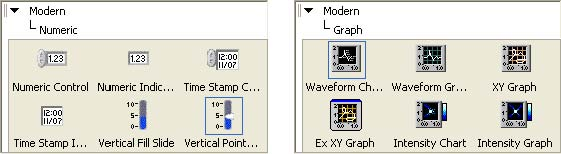
In the Front Panel window, from the Functions » Modern » Numeric select the vertical pointer slide. From the Functions » Modern » Graph select Waveform Chart.
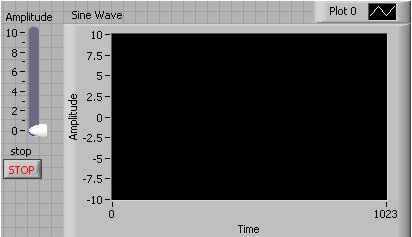
Re-label the vertical pointer slide as Amplitude and the waveform chart as Sine Wave. Re-arrange to GUI to look like the figure below.
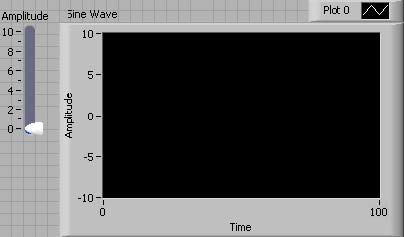
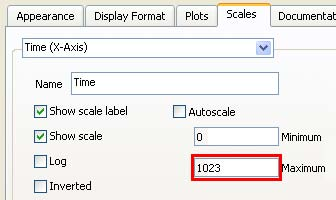
Right click on Sine Wave and selectProperties from the pop-up menu.
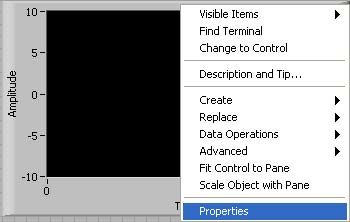
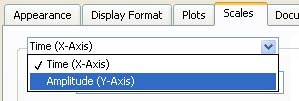
Select the Scales tab and change Maximum to 1023. Sine Wave will display 1024 samples. Click on the down arrow located to the right of Time (XAxis) and select Amplitude (YAxis).
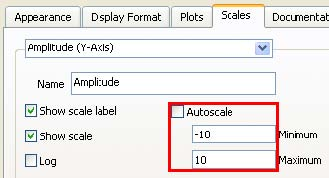
De-select Autoscale and change the Minimum and Maximum values to -10 and 10. Click OK.
De-Selecting Autoscale
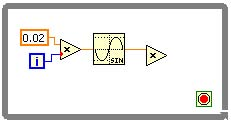
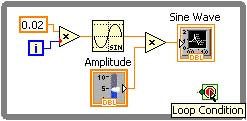
In the Block Diagram window, re-arrange the Amplitude and Sine Wave terminals and finish the program as shown in Interactive Sine Wave Diagram.
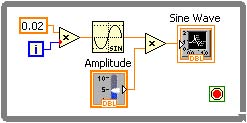
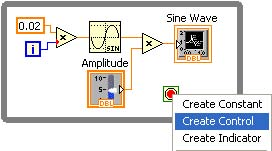
Scroll the mouse pointer over the Loop Control...
And right click on theLoop Control and from the pop-up menu selectCreate Control. A stop terminal is created...
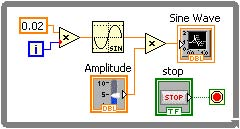
With the correspondingstop Boolean input control. Save the G program as Interactivity.vi.
Run the G program.
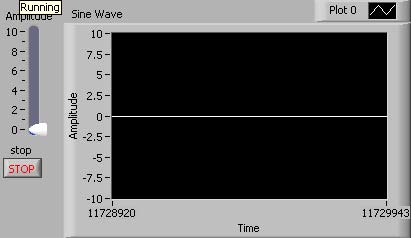
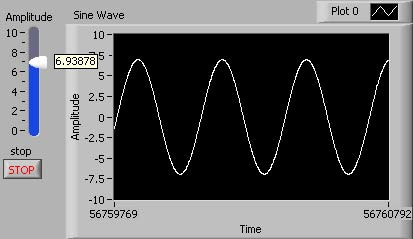
While the program is running, change the Amplitude and watch the graph update to refect the interactive changes.
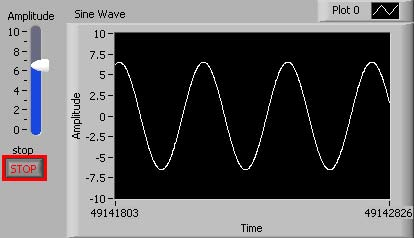
To end the G program, simply click on the stop button. Congratulations. You have successfully completed and executed your first interactive G program.
- 2091 reads
