


Available under Creative Commons-ShareAlike 4.0 International License. Download for free at http://cnx.org/contents/5b6e61df-b830-48cb-9764-94696cb47c80@1.3
Start by building the following program shown in Figure For Loop Sine Wave.
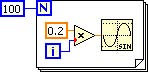
Figure 7.17 For Loop Sine Wave
Right click on the Front Panel window, select Waveform Graph from the Modern »Graph pop-up menu, and drop it on the Front Panel window.
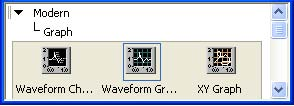
Figure 7.18 Select Waveform Graph
In the Block Diagram window you will see the Waveform Graph terminal. Wire the Sine function output to the Waveform Graph terminal through the For Loop.
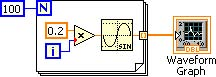
Figure 7.19 Waveform Graph Diagram
Run the program. The resulting graph is shown in Figure Sine Wave Graph.
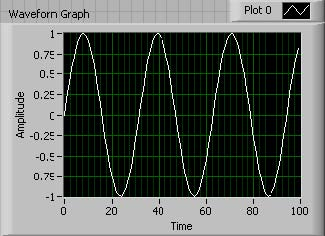
Figure 7.20 Sine Wave Graph
- 2439 reads
