


If the data in the spreadsheet is arranged in simple rows of the same type of data, it can be manipulated to provide reports for basic projects.
If one or more of the columns in a table contain labels, identification numbers, or other descriptions, those labels can be used to specify sorting and filtering options. For example, if the spreadsheet has a list of expenses, the rows of data can be sorted in decreasing or increasing value by one of the data types such as the due date or the amount of the expense. The display can be restricted—filtered—to display only those rows that meet criteria specified by the user. For example, the table could be filtered to display the expenses for a particular department that were incurred between two dates. This ability facilitates the preparation of monthly progress reports and budgets.
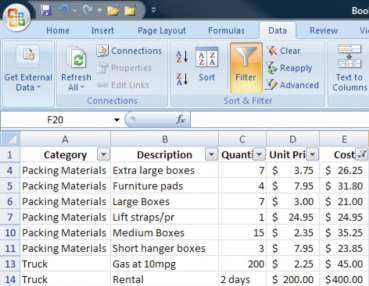
In MS Excel 2007, the sorting and filtering options are on the Data tab, in the Sort and Filter group under the Sort or Filter button. Once a filter is applied, option buttons are placed at the top of each column to facilitate changes in the sorting or filtering options. For example, the list of expenses shown in the previous figure can be sorted by the labels in the Category column and filtered to show only costs that are more than $20, as shown in Figure 6.16.
- 1481 reads
