


During World War II, factories were converted from manufacturing consumer goods to weapons. War plants had to make large numbers of parts as fast as possible while doing it safely for the workers and for the service members who used them. Important improvements in quality control (QC)—the management of production standards through statistical interpretation of random product measurements, which emphasizes consistency and accuracy—were made during this period. A key figure in the history of quality management who was an important person in the war effort was Walter Shewhart at Bell Telephone Laboratories. Shewhart recognized that real processes seldom behaved like theoretical random distributions and tended to change with time. He separated causes of variation into two categories: chance cause and assignable cause. Chance causes could be ignored if they did not cause too much variation, and trying to eliminate them often made the problem worse, but assignable causes could be fixed. To help distinguish between variations caused by random events and trends that indicated assignable causes, Shewhart introduced the control chart, which is also known as a type of run chart because data are collected while the process is running. A control chart has time on the bottom axis and a plot of sample measurements. The mean, upper control limit, lower control limit, and warning lines that are two sigma from the mean are indicated by horizontal lines.
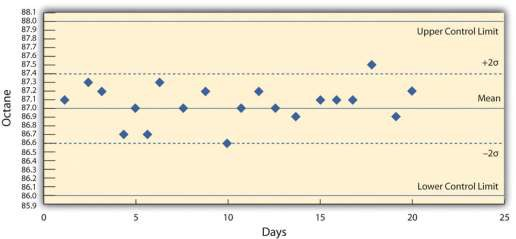
Control Chart Shows Production Variation of Gasoline
The refinery quality control manager takes samples each day of the 87 octane gasoline for twenty days and charts the data on a control chart, as shown in Figure 10.6.
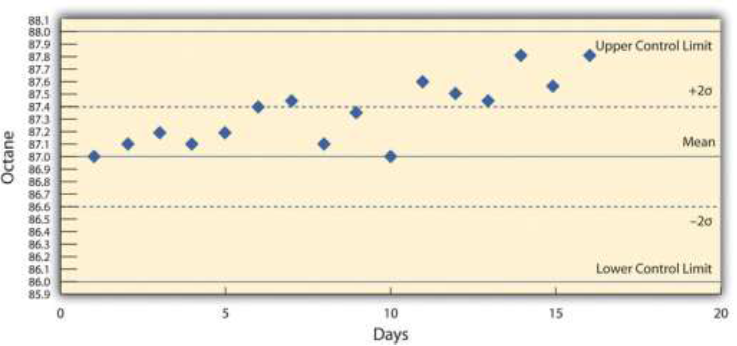
She recognizes that the highest and lowest measurements are not part of a trend and are probably due to chance causes. However, the control chart from the next twenty days, as shown in Figure 10.7, indicates an upward trend that might be due to an assignable cause. She alerts the process manager to let him know that there is a problem that needs to be fixed before the product exceeds the upper control limit. This might indicate the need to initiate a project to fix the problem.
- 2840 reads
