


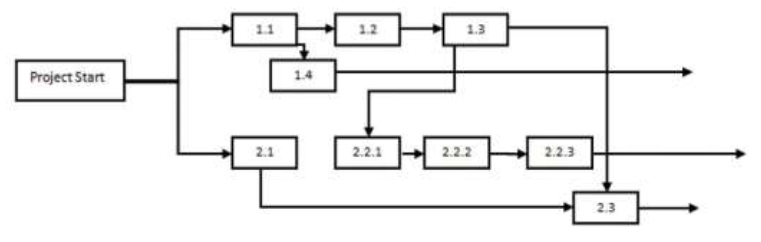
People recognize relationships and patterns more effectively when they look at diagrams like the one in Figure 8.11. The precedence diagram method (PDM) is a technique for graphically displaying the logic of the schedule by placing the activities in boxes with arrows between them to show the precedence-successor relationships. The boxes in this type of diagram are called nodes and the arrows indicate finish-start relationships. Compare the diagram in Figure 8.11 to the outline in Figure 8.6 to see how much easier it is to trace a sequential path from one activity to the next in the precedence diagram. This type of diagram is also called a project network diagram.
KEY TAKEAWAYS
- The work breakdown structure is a list of activities, including estimates of their durations, their relationships with others, and the resources assigned to them.
- Bar charts are used to indicate durations and sequencing where the relationships are simple. Network diagrams are used to show complex relationships between activities.
EXERCISES
- What is work breakdown structure?
- If two activities are concurrent and they have the same completion date, they have a - relationship.
- A calendar that shows when a person, facility, or key piece of equipment is available is a calendar.
- What is the advantage of a network diagram over a bar chart for illustrating the critical path?
Compare Charts
Perceptions of graphic representations of data differ among individuals. Consider the bar chart and network diagram in this section. Describe which type of chart conveys the important aspects of the project best to you personally and why you think that is the case. Alternatively, describe which aspects of the project are conveyed to you best by which type of chart.
- 2933 reads
