


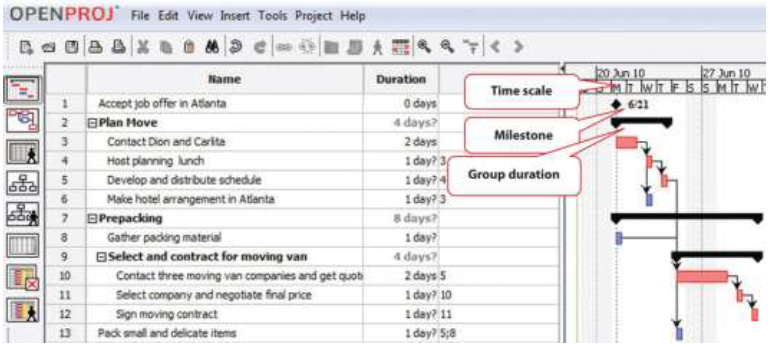
The type of bar chart used to illustrate activity relationships in a project is the Gantt chart. The Gantt chart was developed by Henry Gantt and used on major projects, including building the Hoover Dam and the U.S. interstate highway system. 1 The Gantt chart, also called a bar chart, is a time-scaled graphic that represents each activity with a bar that reflects the duration, start, and finish time, as shown in Figure 8.10.
A Gantt chart is easy to read and provides sufficient information for project team members to plan activities within a short time frame. For many larger projects, a two-week bar chart, extracted from the larger master schedule, provides the information needed for team members and contractors to coordinate activity details. The Gantt chart provides information for simple planning but is limited because a Gantt chart does not illustrate complex relationships well.
- 2395 reads
