


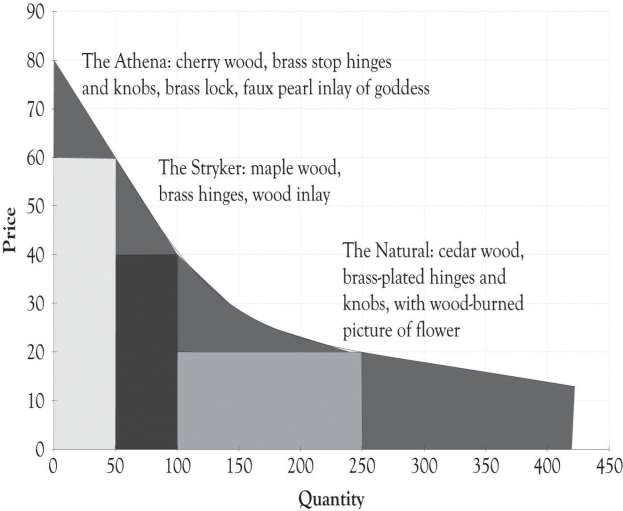
The demand curve for a good does not have to be linear or straight. As illustrated in Figure 3.11, the demand curve could be curvilinear. It appears that the price at which there is no demand is $80 and that there is essentially unlimited demand for jewelry boxes that cost $15. Let us examine how a different and, in particular, a nonlinear curve could influence the amount of revenues generated. Using Figure 3.11, if Joan charges $60 for the Athena unit, she would sell 50 units. If she charged $40 for the Stryker model, she would sell 50 units (100 − 50). If she charged $20 for the Natural, she would sell 150 units (250 − 100). If Joan still had the same variable cost structure as before, she would generate the following revenues and profit:
Profit = ($60 − $30) × 50+ ($40 − $15) × 50+ ($20 − $10) × 150 − $2,000 ← {fixed costs}
Profit = $1,500 + $1,500 + $1,500 − $2,000
Profit = $4,500 − $2,000
Profit = $2,500
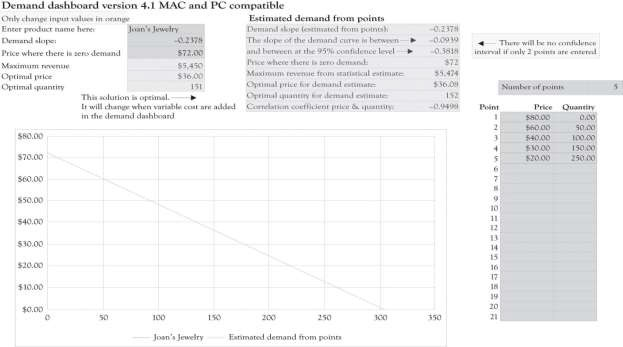
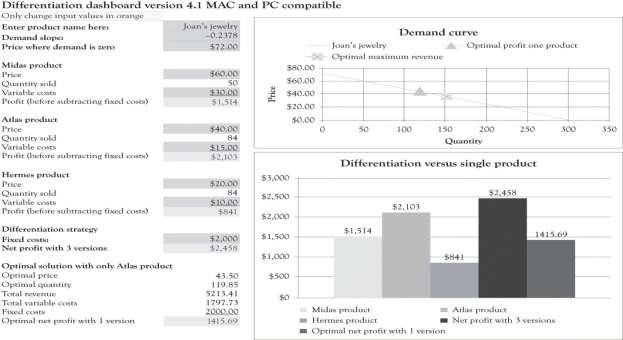
This amount is noticeably less than the $3,216 algebraic solution ($47 × 163 − $15 × 163 − $2,000) for the single version where it was assumed that demand was linear. This example illustrates that a slight miss in identifying the appropriate demand function can have a dramatic impact on profitability. Even though the demand and differentiation dashboards can only deal with linear relationships, we can estimate a linear function using only a portion of the demand curve. It appears that there is a linear relationship within the price range of $20–$80. The price where demand is zero (the Y intercept) and the slope of the demand curve were both estimated using the demand analysis dashboard as illustrated in Figure 3.12. Figure 3.13 shows the solution for the nonlinear demand curve using the differentiation dashboard. The key difference for this solution versus the solution that was presented earlier in the chapter is that the demand curve was estimated using points that were not linear with a linear regression algorithm. This leads to several interesting results.
The profit for one product using the optimal solution for the nonlinear curve is $1,415.69. Using Figure 3.13, again you can see that when the original variable and fixed costs are entered in the differentiation dashboard, three versions produce a net profit of $2,458. This is in contrast to the $4,500 profit for the three versions using the original linear demand curve.
When the demand is nonlinear, economists use “tricks” to transform a nonlinear demand data into a linear formula. 1 For example, they take the natural log of the price and quantity data and then perform the regression analysis in order to develop an estimate of the function. The trick I used was to estimate the demand function by only using prices between $20 and $80.
If a new product is being introduced, then there may not be any data available for estimating a demand curve. Historical data are often scarce or nonexistent for new products and significantly revised versions of products. Sometimes, the entrepreneur has only two points for estimating demand. The first point is where the price crosses the Y-axis. This is essentially the maximum amount that most consumers would be willing-to-pay for a product. The second point is also a guestimate using a hypothetical question. What demand would result if we were to introduce a product at the prevailing market price using typical product features?
The key takeaway is that it is difficult to model consumer demand when products are new and untested, and even where there is a proliferation of historical data, it is still a difficult task. Another takeaway is that versioning will almost always generate more revenues and also greater profits in the long run. The crucial activity is to constantly experiment and continuously introduce product versions in order to understand the constantly changing nature of consumer behavior. Quantitative tools can provide insight, but they should be used to provide insight and not used as a sole solution for pricing and versioning products.
From an economist point of view, the primary goal of versioning is to capture consumer surplus. As one of my economist colleagues (Bill Hamlen) noted, it is very difficult to develop a reasonable mathematically grand optimal solution for capturing consumer surplus with even two versions. Economists have not attempted to tackle the problem of versioning because of the mathematical complexity. I have taken the liberty of using the same demand curve for all the versions. In reality, there is a separate demand curve for each version. Bill Hamlen suggested that since it is so difficult to find a grand optimal solution, that I should continue the approach used in the book because it still provides an insight into the important issue of capturing consumer surplus from a strategy perspective.
- 瀏覽次數:35928
