


Multiple plots in a single figure can be generated with subplot in the Command Window. However, this time we will use the built-in Plot Tools. Before we initialize that tool set, let us create the necessary variables using the following script:
    % This script generates sin(x) and cos(x) variables
clc                 %Clears command window
clear all           %Clears the variable space
close all           %Closes all figures
X1=[-2*pi:.1:2*pi];     %Creates a row vector from -2*pi to 2*pi with .1 increments
Y1=sin(X1);             %Calculates sine value for each x
Y2=cos(X1);             %Calculates cosine value for each x
Y3=Y1+Y2;               %Calculates sin(x)+cos(x)
Y4=Y1-Y2;               %Calculates sin(x)-cos(x)
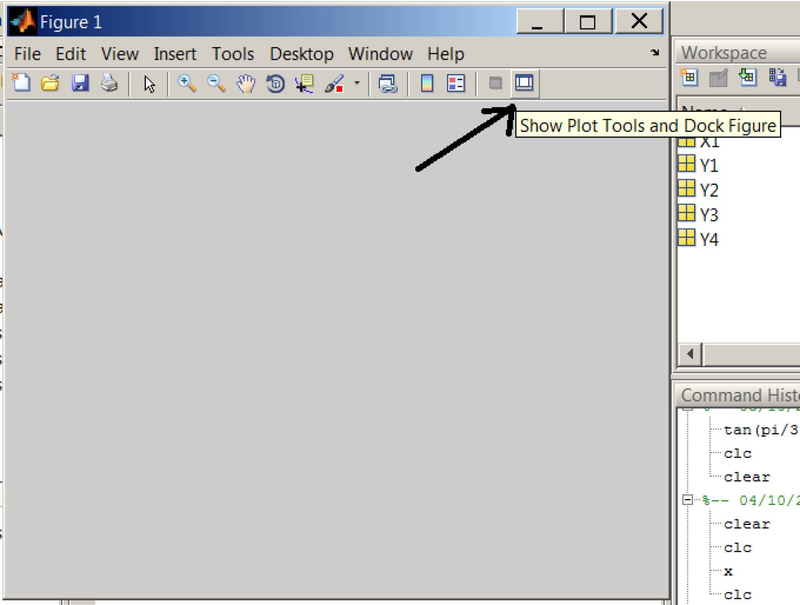
Note that the above script clears the command window and variable workspace. It also closes any open Figures. After running the script, we will have X1, Y1, Y2, Y3 and Y4 loaded in the workspace. Next, select File > New > Figure, a new Figure window will open. Click "Show Plot Tools and Dock Figure" on the tool bar.
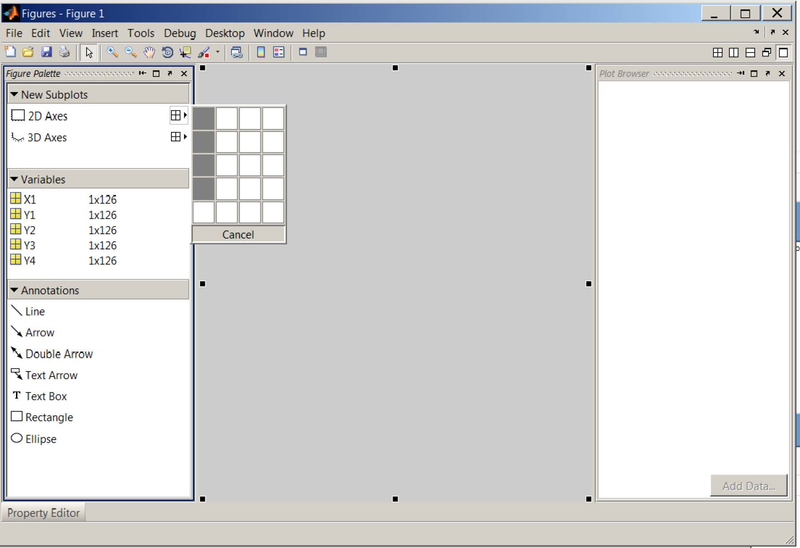
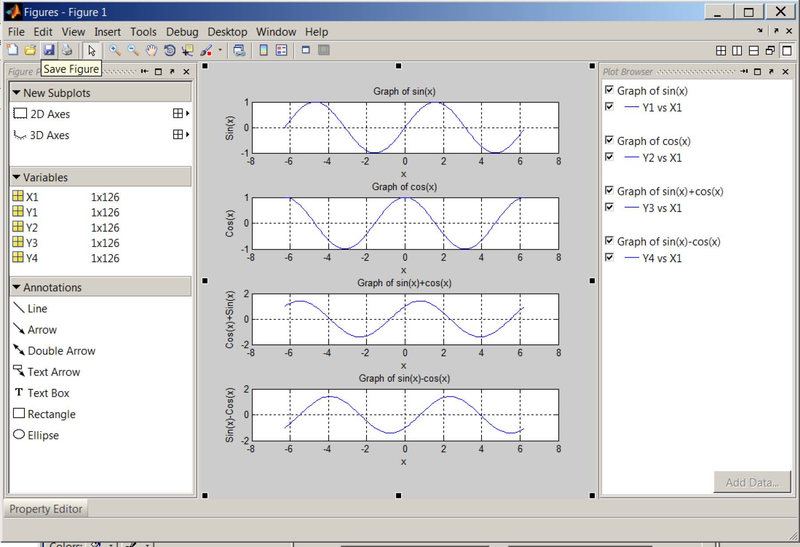
Under New Subplots > 2D Axes, select four vertical boxes that will create four subplots in one figure. Also notice, the five variables we created earlier are listed under Variables.
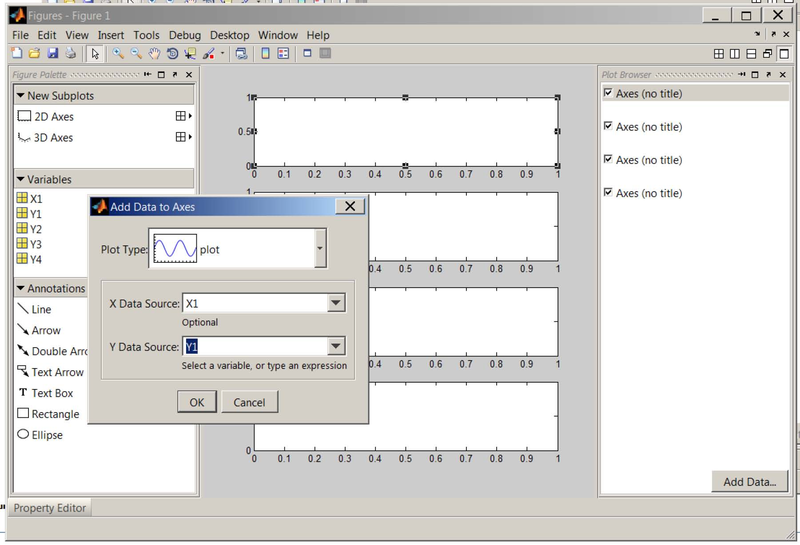
After the subplots have been created, select the first supblot and click on "Add Data". In the dialog box, set X Data Source to X1 and Y Data Source to Y1. Repeat this step for the remaining subplots paying attention to Y Data Source (Y2, Y3 and Y4 need to be selected in the subsequent steps while X1 is always the X Data Source).
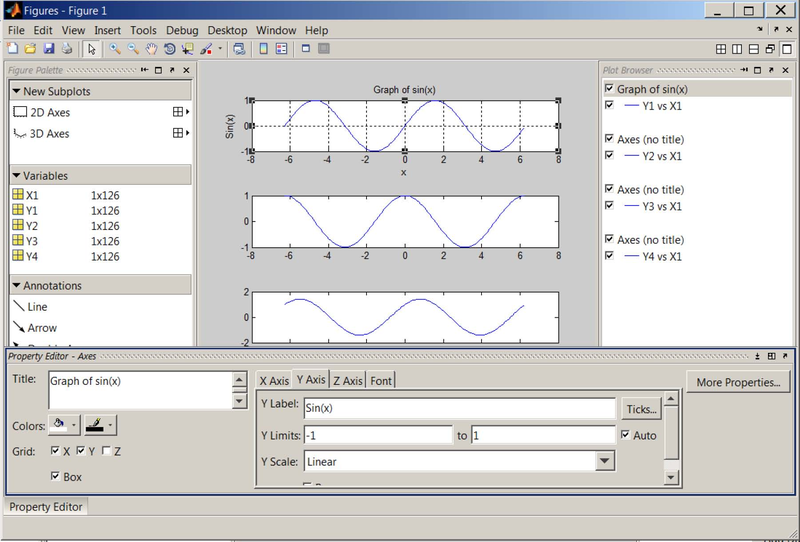
Next, select the first item in "Plot Browser" and activate the "Property Editor". Fill out the fields as shown in the figure b elow. Repeat this step for all subplots.
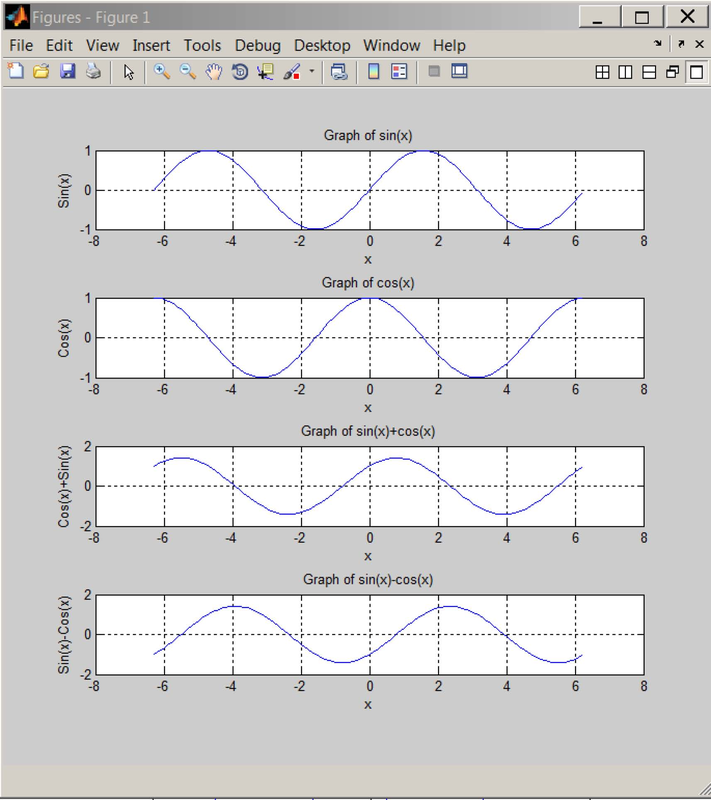
Save the figure as sinxcosx.fig in the current directory.
- 2702 reads
