


Available under Creative Commons-ShareAlike 4.0 International License.
    x = pi/100:pi/100:10*pi;
y = sin(x)./x;
plot(x,y),title('Graph of y=sin(x)/x'),xlabel('x'),ylabel('y'),grid
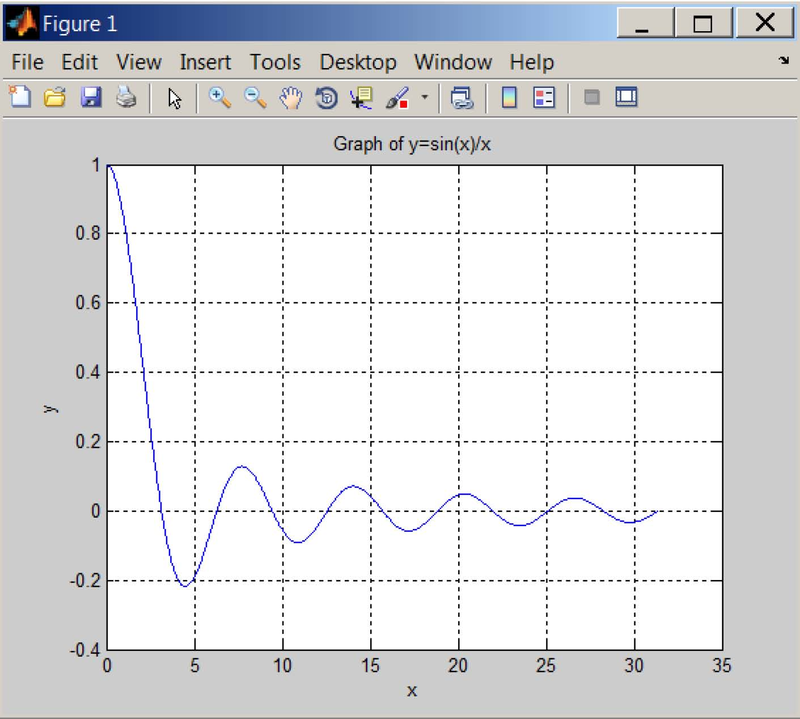
Figure 3.16 Graph of y = sin(x)/x
- 瀏覽次數:1992
