


Available under Creative Commons-ShareAlike 4.0 International License.
Type in the following statement at the MATLAB prompt:
x=[-pi:.1:pi]; y=sin(x); plot(x,y);
After we executed the statement above, a plot named Figure1 is generated:
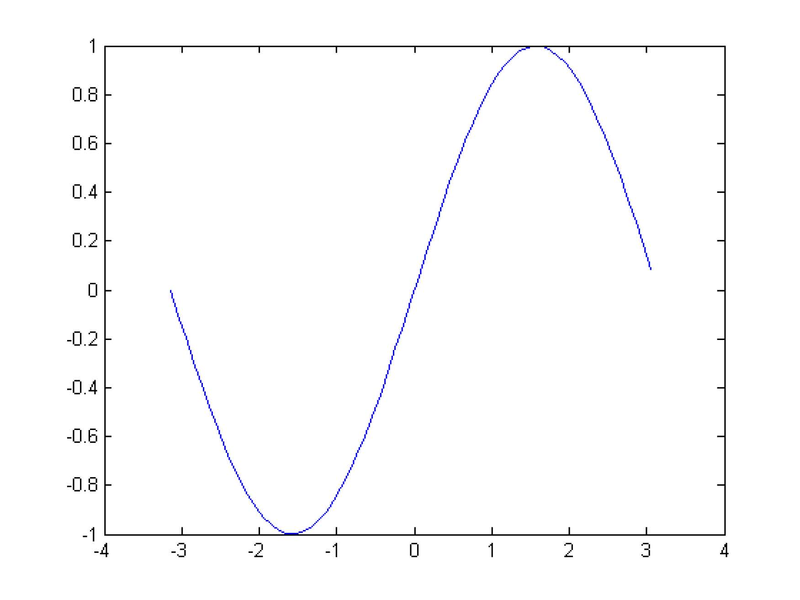
Figure 3.1 Graph of sin(x)
Having variables assigned in the Workspace, x and y=sin(x) in our case, we can also select x and y, and right click on the selected variables. This opens a menu from which we choose plot(x,y). See the figure below .
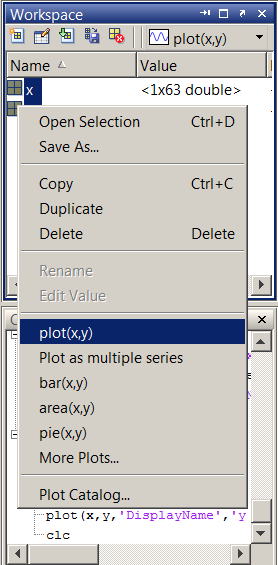
Figure 3.2 Creating a plot from Workspace.
- 瀏覽次數:2057
